by Shawn Burke, PhD
Summary
In this post – the sequel to Part 25: Impulse Part 1 – we characterize the role of force, cadence, and power phase duration in propulsion. We’ll also investigate whether distance per stroke is a fundamental parameter driving our hulls, or whether it is a derived (e.g., second order) property.
Background
As you’ll recall from Part 5: What Moves You, the motion of a paddled hull can be described in terms of its momentum p. Momentum is the product of the craft’s mass, plus the mass of its occupants and gear, times its velocity. Momentum is a vector (e.g., directional) quantity because velocity is a vector.[1] For this article we’ll only consider velocity’s magnitude in the direction of motion, which we know best as the hull’s speed. Hereafter ‘v’ refers to speed in the direction of motion. It is a scalar quantity.
Impulse quantifies a force’s influence in changing an object’s momentum. Since the mass of the hull and its contents is fixed, a change in momentum ∆p then corresponds to a change in its speed ∆v. This change in momentum corresponds to the impulse applied by the paddler via their paddle. With each stroke the hull speeds up during a stroke’s power phase, then slows down because of drag[2] until we initiate the next stroke. This cycle repeats itself stroke after stroke.
Impulse Dp is the product of the propulsive force Fp exerted over a stroke’s duration Dt,

This expression for impulse applies to all paddled craft, all paddling styles, and to poling as well.
We wish to characterize the role of force, cadence, and power phase duration on propulsion. In this article we’ll consider a bent shaft canoe paddle with properties and baseline operating values listed in Table 1. The analysis applies to any paddle or paddling discipline merely by specifying other values for these parameters.
Table 1: Baseline model parameters
r = 1000 kg/m3 (water density)

Blade area = 0.1 m2

Cd = 1.15 (blade drag coefficient)

Stroke duration = 1 sec

Power Phase duration = 0.7 sec

Peak force scaling = 1[3]
Using the model developed by Caplan,[4] this paddle operating as specified generates the propulsive force versus time curve in Fig. 1. The paddle moves over a shaft angle range from –30 degrees to +50 degrees. We covered this model in detail in Part 11: About the Bend.
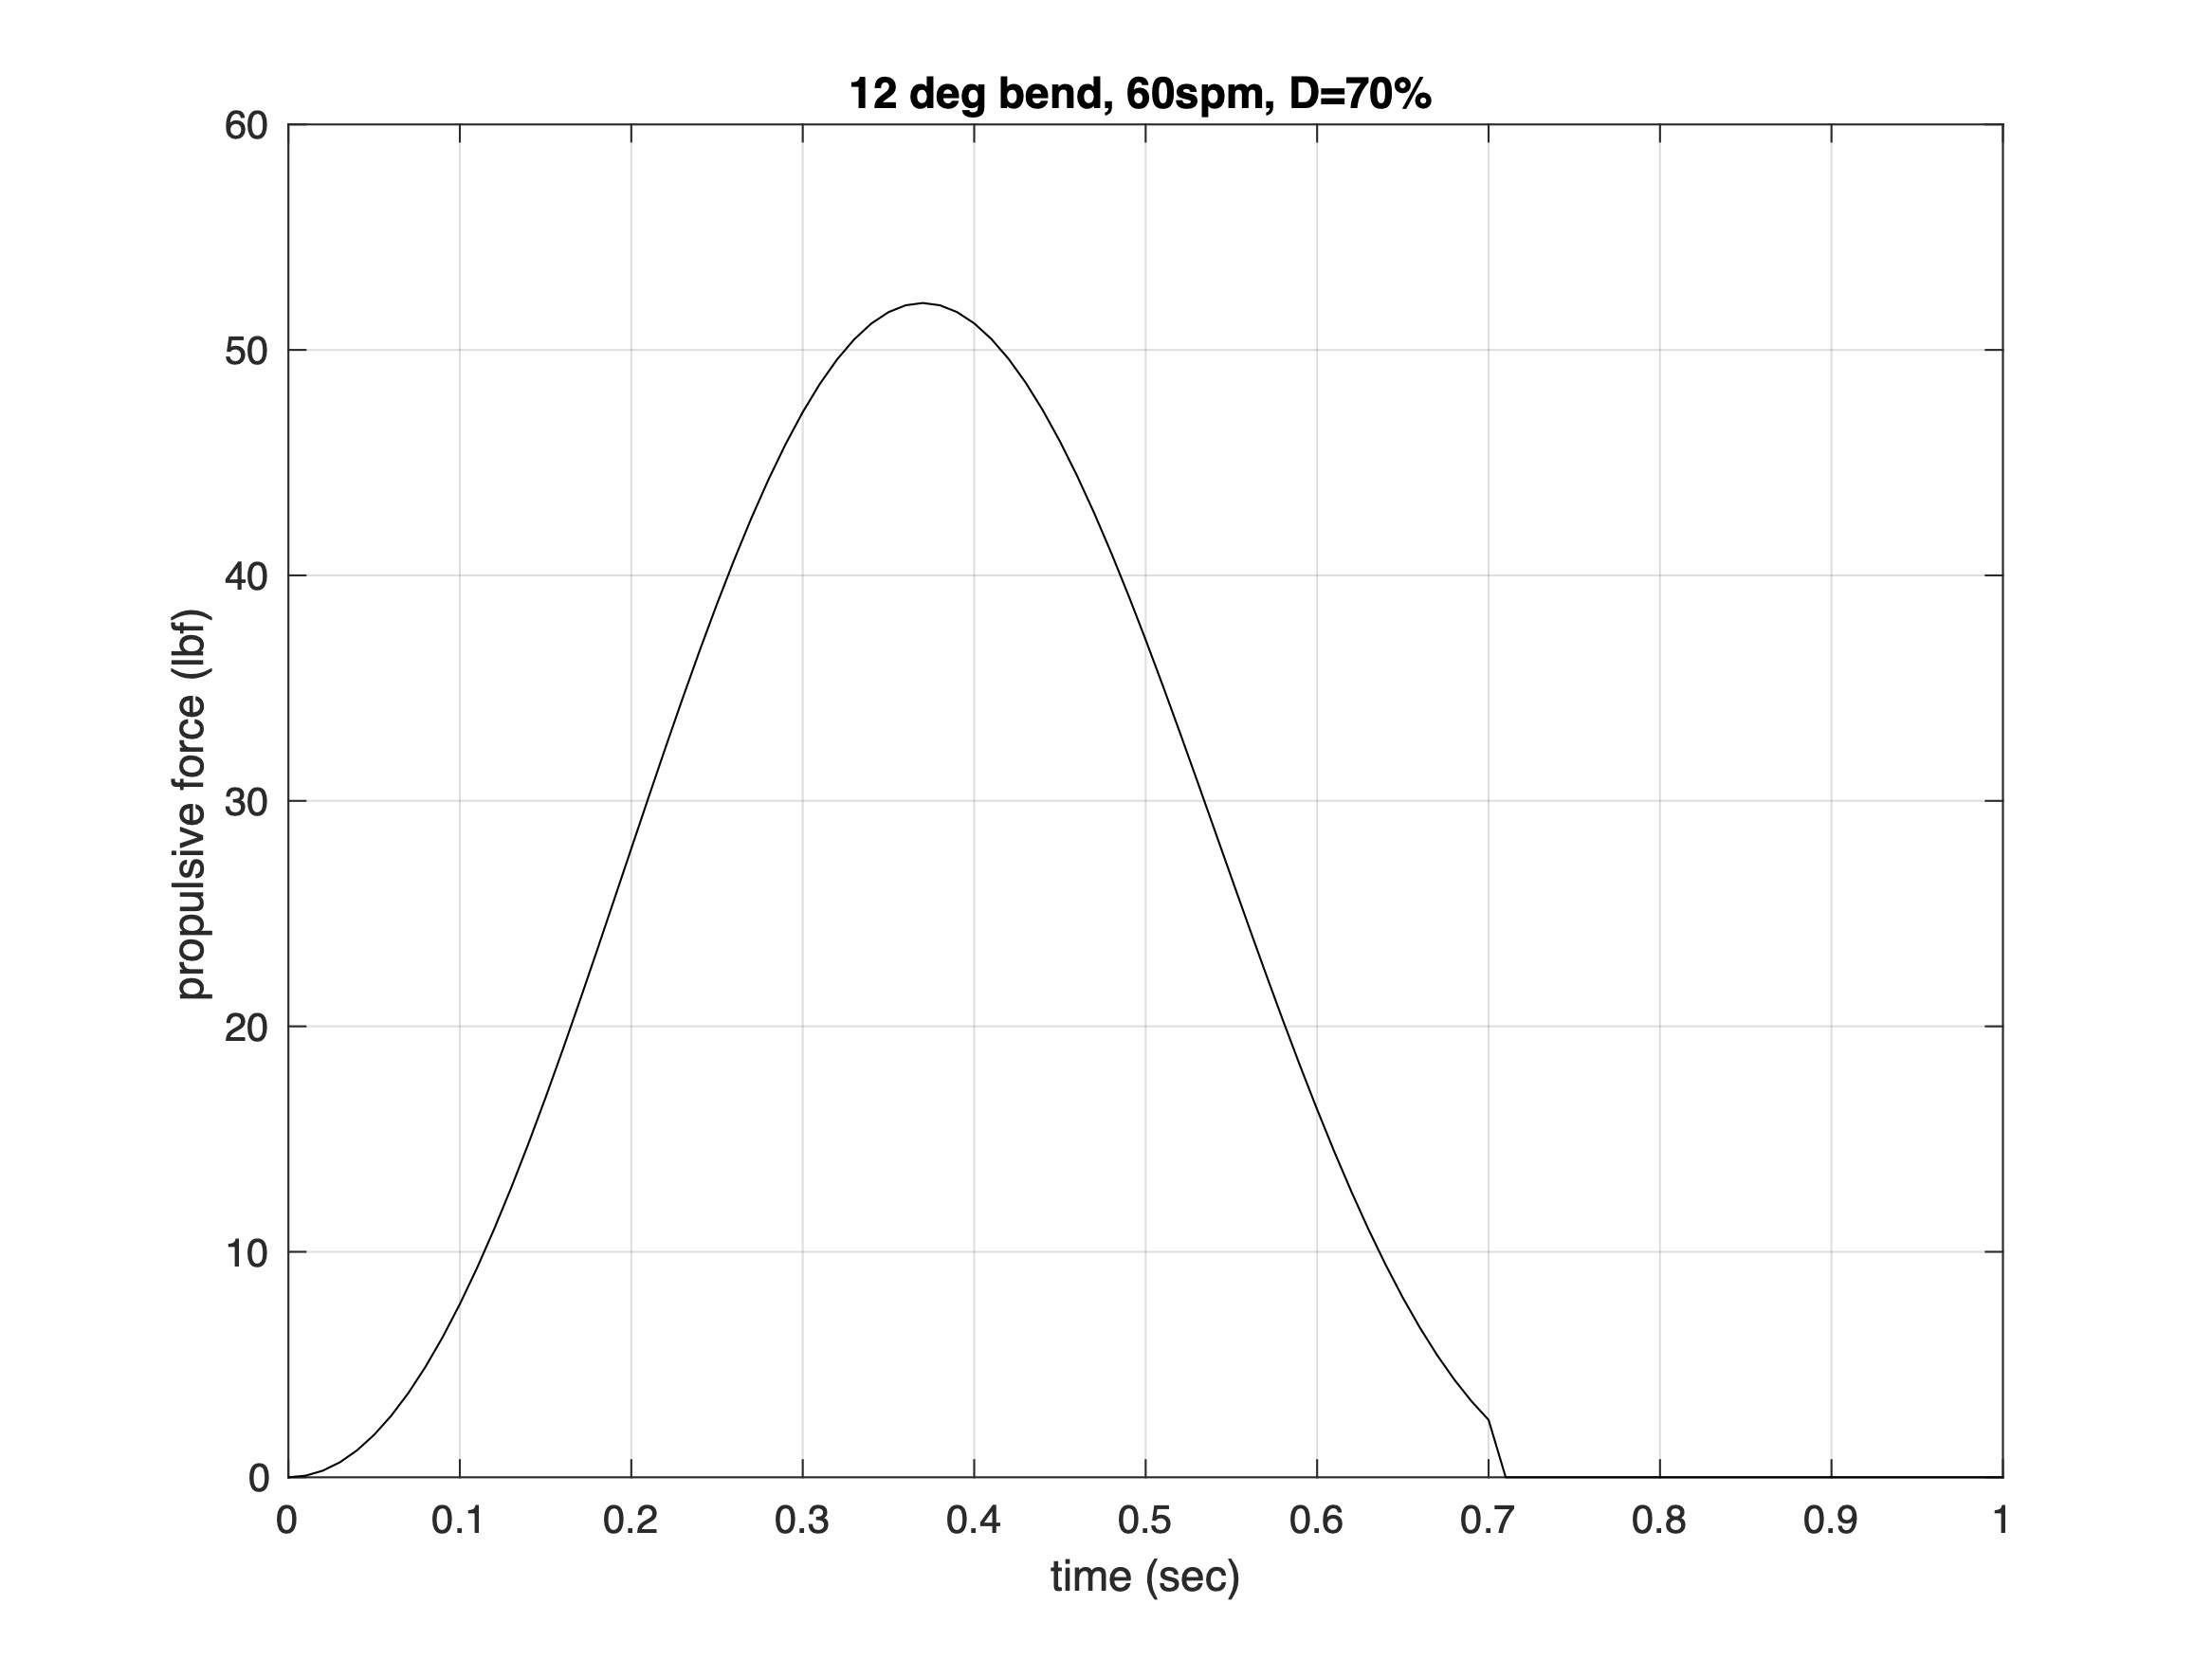
Figure 1: Paddle propulsive force versus time.
We’ll use this baseline model, and variations of it, in the rest of this article. We’ll begin by carefully defining what we mean by propulsive force.
Propulsive Force vs. Paddle Force
When paddling we exert forces on the paddle’s shaft. In response, the paddle blade exerts a distributed force on the water, e.g., a pressure, over the blade’s surface. A fundamental tenet of fluid mechanics is that pressure must act perpendicular to surfaces. Here, it acts perpendicular to the blade at every point on its surface.
The net force exerted by the blade is the sum of these distributed pressures. The resulting force must itself be always perpendicular to the blade, irrespective of the blade angle. We’ll represent the net force as the vector F, as shown in Fig. 2 for a straight shaft paddle and in Fig. 3 for a bent shaft paddle.
We can measure the magnitude of the blade force F using (for example) strain sensors. And we measure it knowing it is always directed perpendicular to the blade’s power face.
However, a hull is propelled (and slowed down) by net forces acting coincident with the direction of travel. And the direction of travel is always parallel to the water’s surface.[5] As shown in Figs. 2 and 3, the propulsive force acts opposite the direction of travel owing to Newton’s Third Law of Motion. We see that the angle between the propulsive force and the blade’s power face changes as the paddle rotates through the power phase.
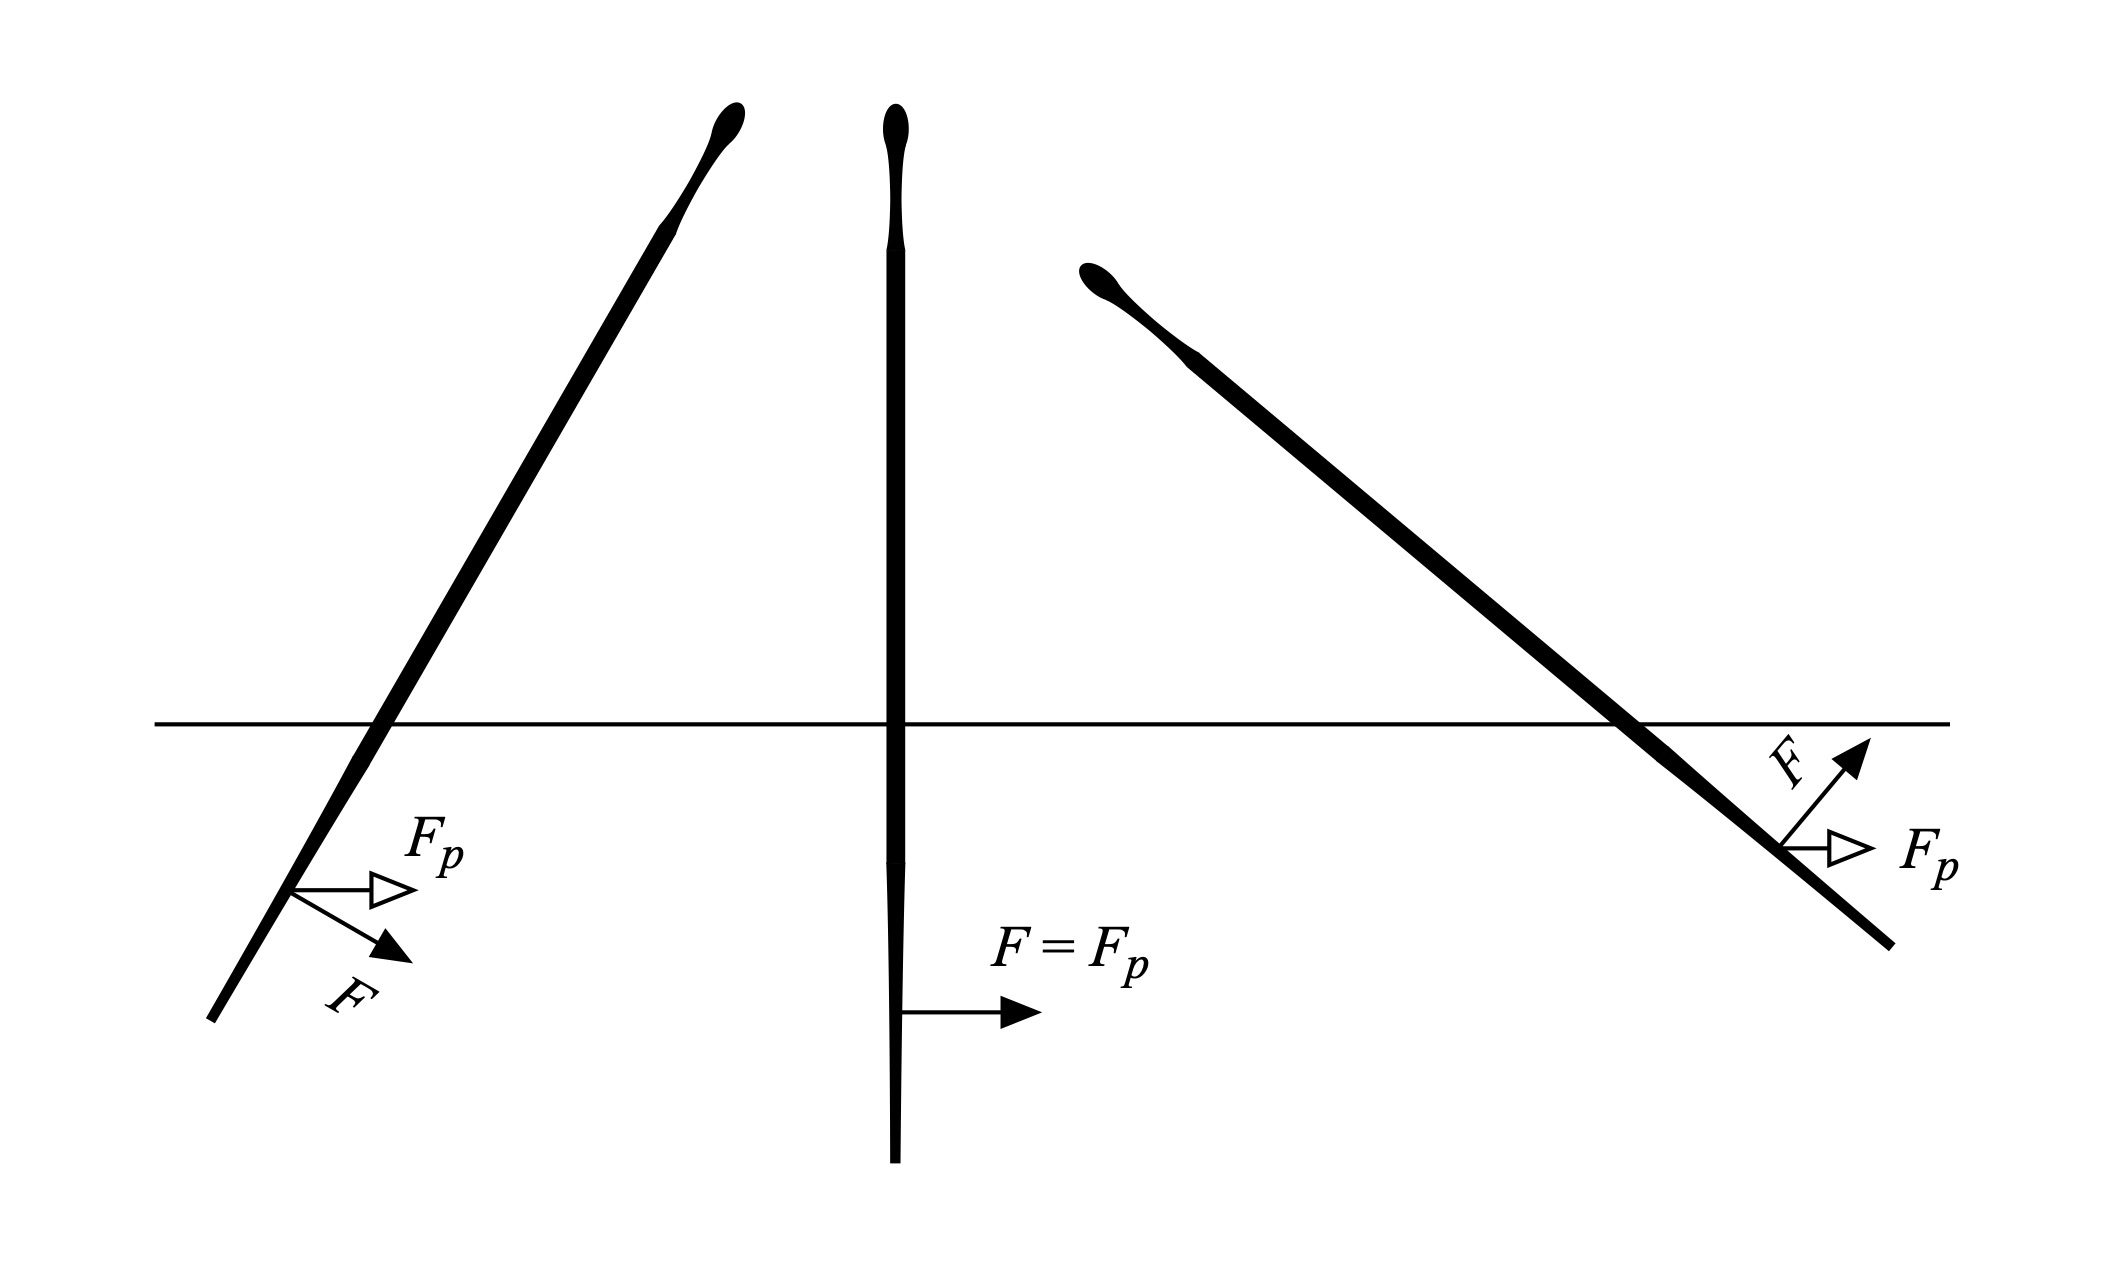
Figure 2: Paddle and propulsive forces, straight shaft, shaft angles -30 to +50 degrees.
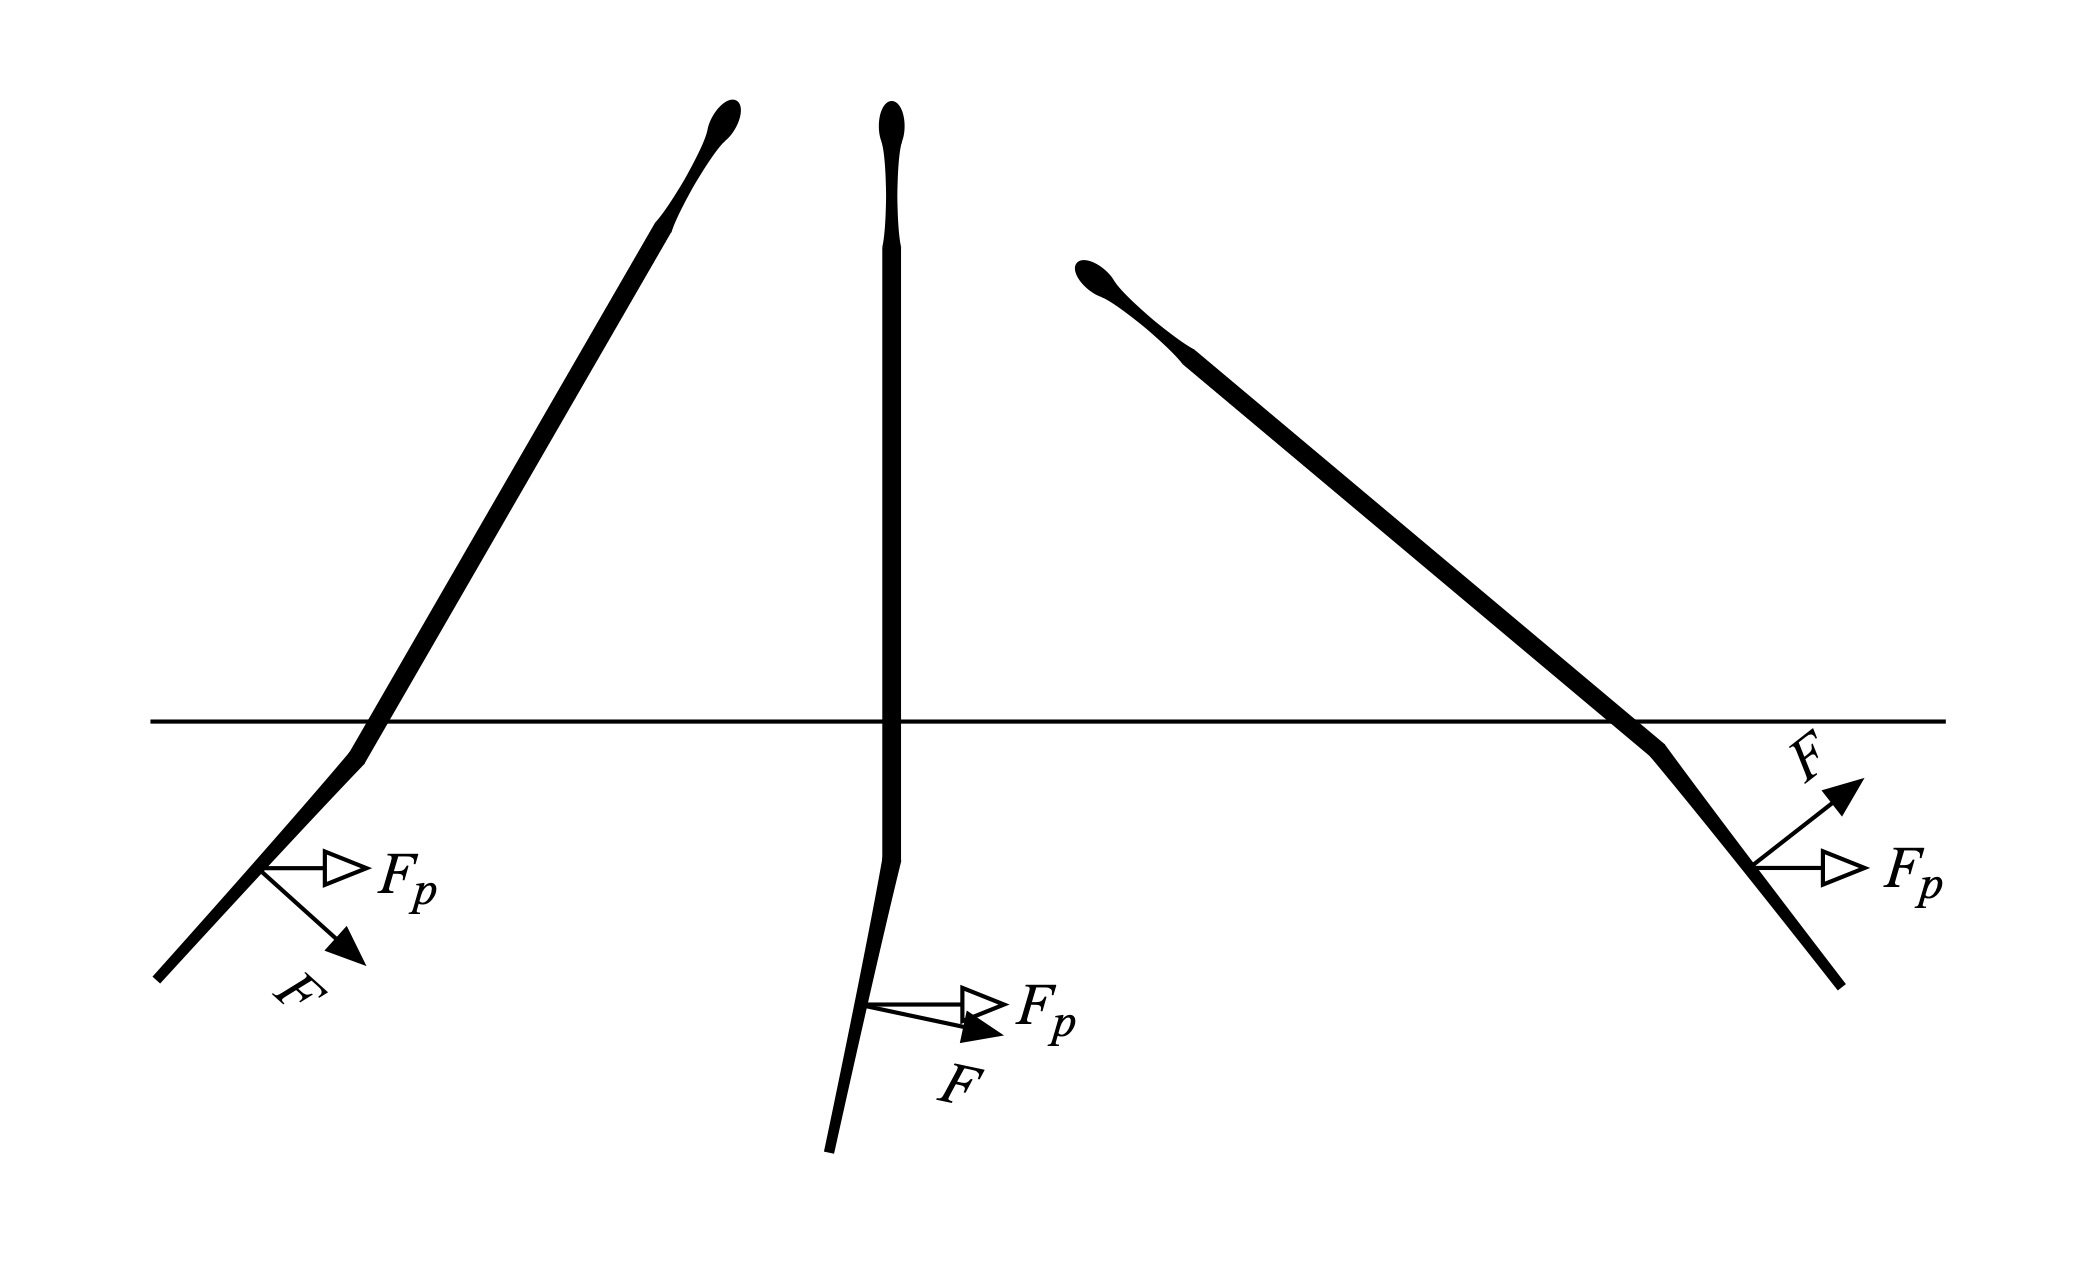
Figure 3: Paddle and propulsive forces, bent shaft, shaft angles -30 to +50 degrees.
Consequently, we must weigh the net force F as a function of the blade’s angle with respect to the vertical to derive the propulsive force Fp. The way we do this is to measure the shaft angle and multiply the blade force by that angle’s cosine, as we did in Part 11: About the Bend. One can (for example) use a solid-state IMU to make this measurement. Thus,

where q is the angle of the shaft from the vertical, and f is the bend angle (if present) between the shaft and blade.
Cadence and Duty Factor
We have defined impulse in terms of a time interval Dt over which we exert a propulsive paddling force. Let’s carefully define what this time interval is for paddling. Much like walking or running has a gait cycle that corresponds to the various elements of leg motion during human locomotion (lift-swing-step-stance), the “paddle cycle” can be broken down into a sequence of events with corresponding durations as shown in Fig. 4.
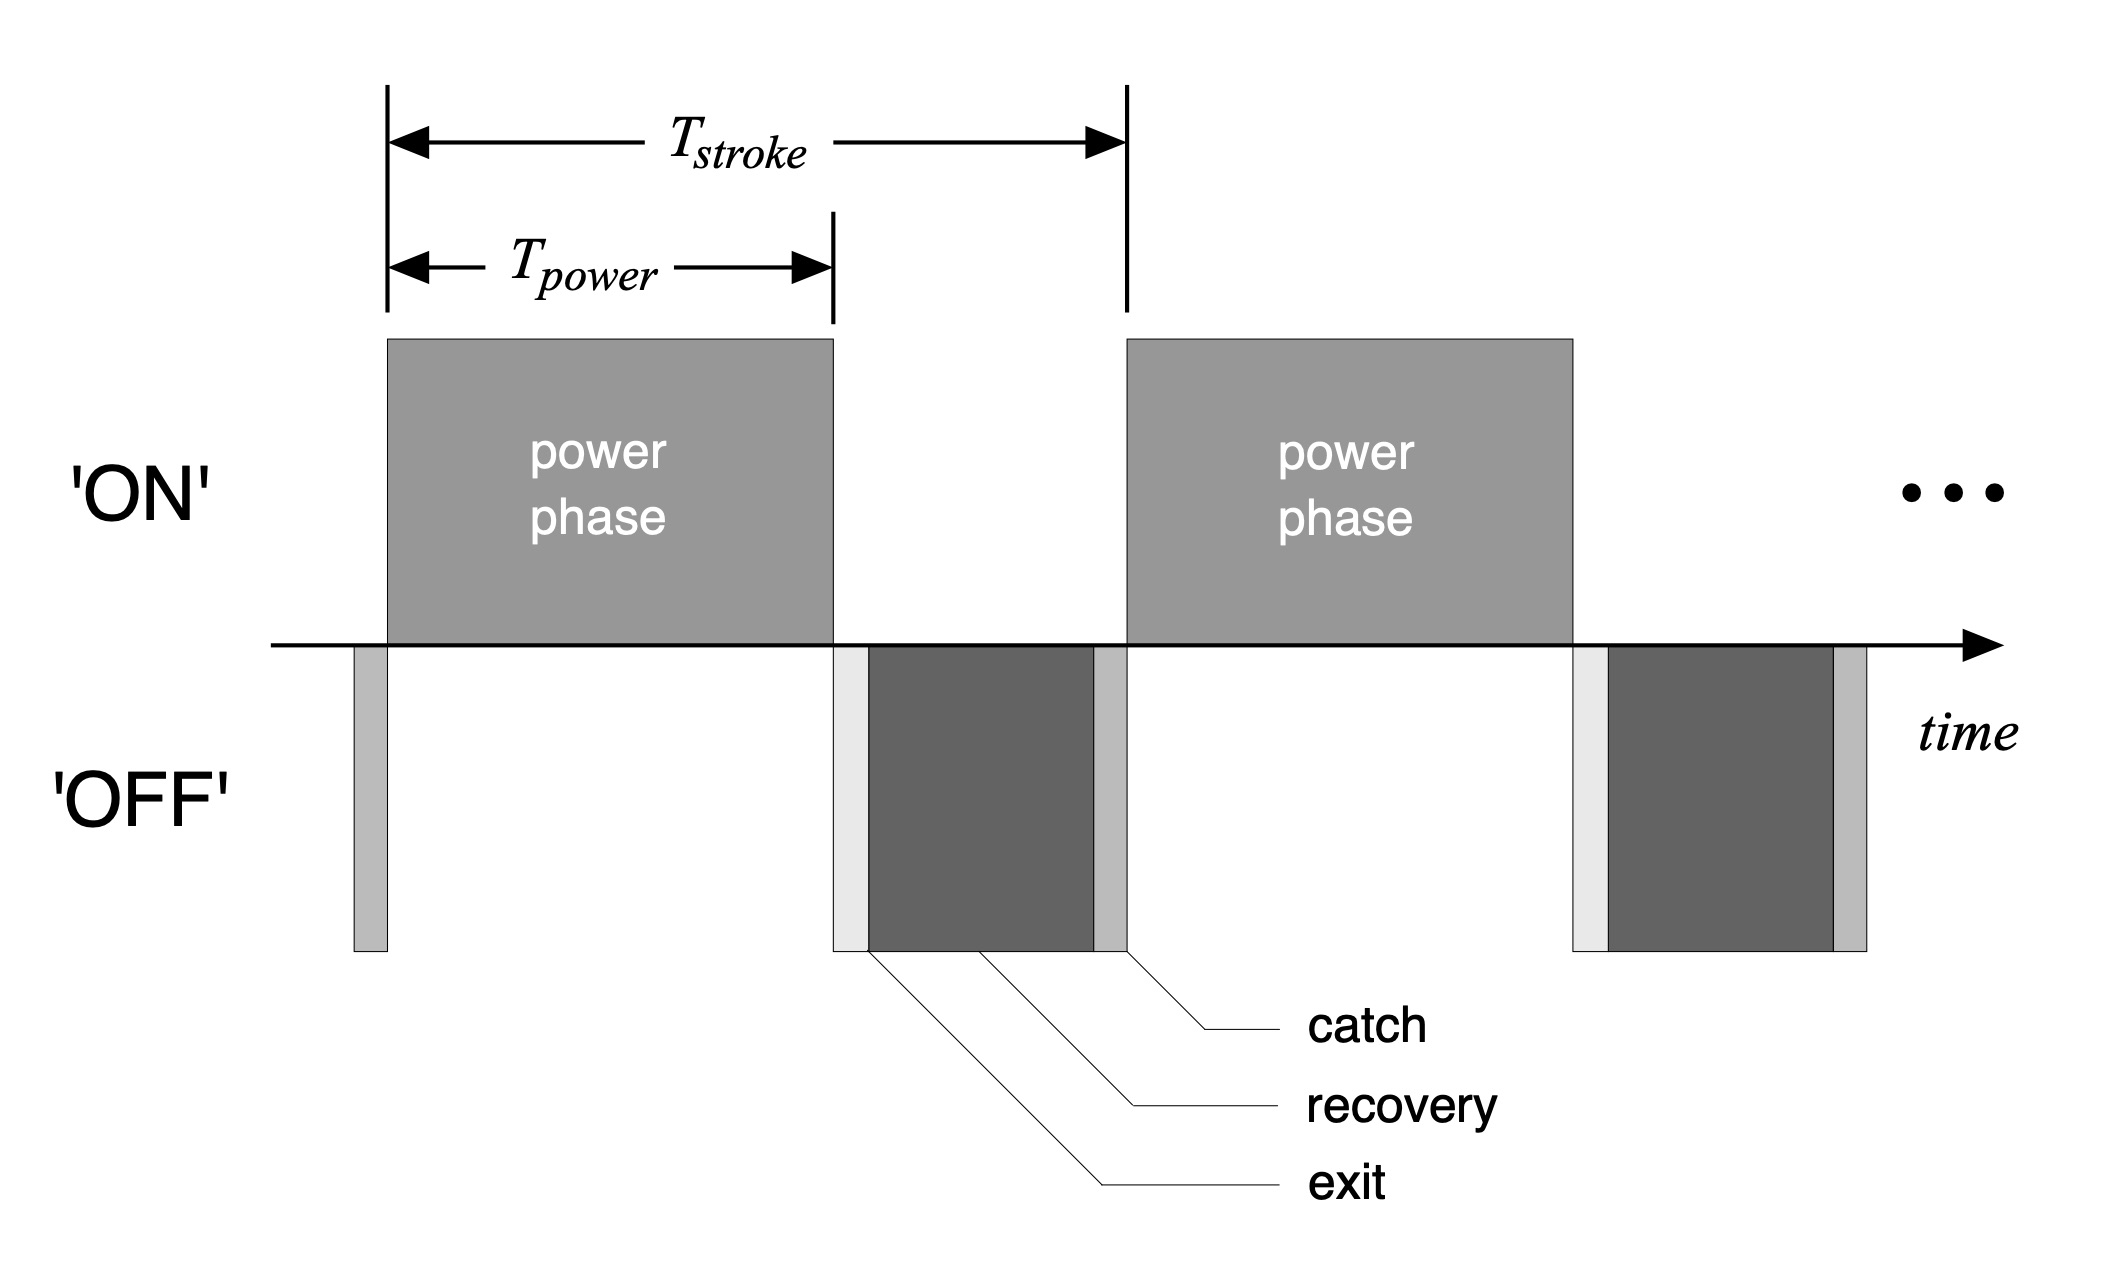
Figure 4: Paddle cycle definitions.
Referencing Fig. 4, we’ll define the power phase as the event and corresponding time interval during which a propulsive force is exerted opposite to the direction of travel. The exit is the event and corresponding time interval during which the blade is being drawn out of the water. The recovery is the event and corresponding time interval over which the blade is out of the water and moving forward. And the catch is the event and corresponding time interval during which the blade is inserted into the water, and where no force opposite to the direction of travel is exerted. Using these definitions, a stroke’s time duration is the sum of the time durations of each element,

Since ∆t in the expression for impulse corresponds to the time over which the propulsive force is exerted, ∆t is the duration of the power phase Tpower.
This definition isn’t very useful if we wish to parameterize paddling in terms of cadence. Cadence is the number of strokes over a specified time interval, such as strokes per second (less common) or strokes per minute (most common). Consider the propulsive force versus time plotted in Fig. 5, which is just Fig. 1 with a few new quantities included. Per Table 1, the baseline cadence is 60spm (strokes per minute), or one stroke per second. The x-axis in Fig. 5 then covers exactly one stroke. At zero seconds the catch is complete, and the pull has started. Since per Table 1 the power phase is specified to last 0.7 seconds, the exit occurs there. Note that the paddle is still loaded (e.g., the propulsive force is greater than zero) at exit; we’ll examine that a bit later. The peak force is 52.4 lbf. Over the power phase the average force is 27.05 lbf, as indicated in the figure. This is the force we’d use to compute impulse, with a corresponding time duration of Tpower.
It is more useful to use the average force over the entire stroke since this time interval corresponds to the stroke cadence. Per our definitions above, the propulsive force is zero outside the stroke’s power phase. Consequently, the average propulsive force over the entire stroke is less than the average force over the power phase, as indicated in the figure. For our baseline the average propulsive force over the entire stroke is 18.94 lbf.
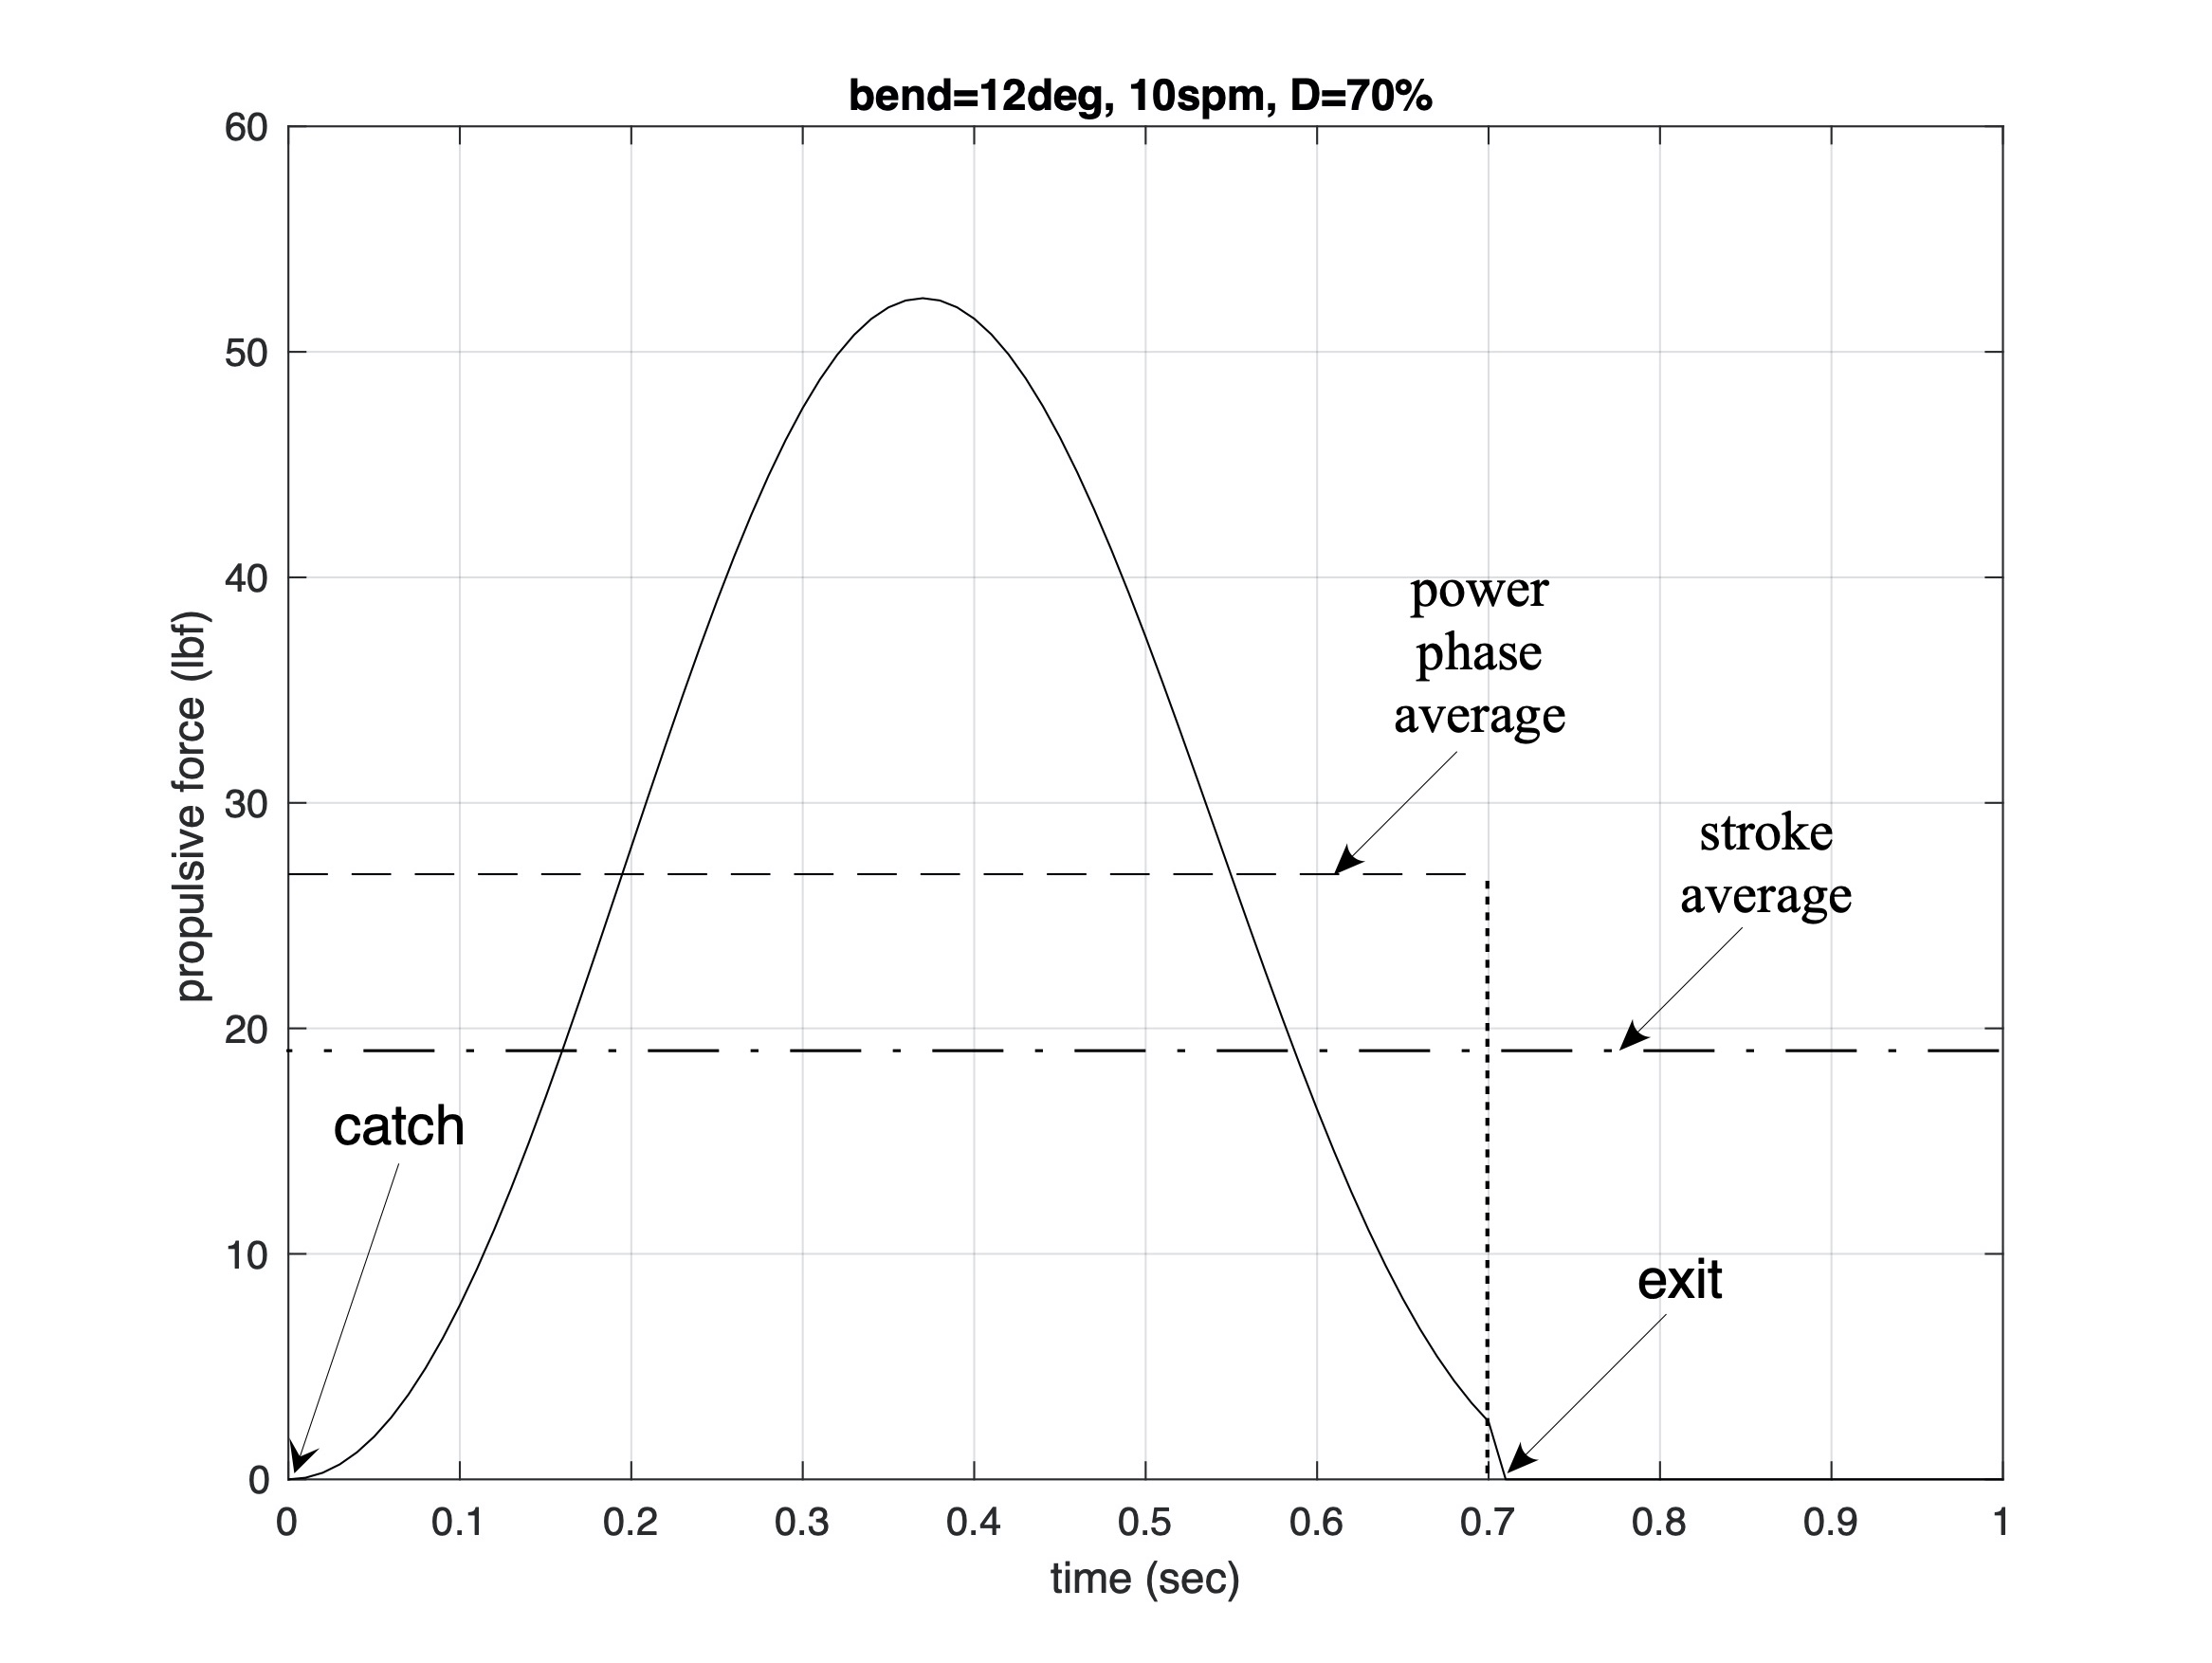
Figure 5: Time intervals, force, and force averages.
The force curve over time, and average force over the power phase, are quantities we’d measure using an instrumented paddle. The average force is just the integral over the power phase of the force curve, divided by the duration of the power phase. Yeah, that sounds like calculus, and it is. But the integral is just the area under the force curve, and it’s easy to compute.
Fortunately, the average force over the stroke is just the product of the average force over the power phase times the duty factor D. The duty factor is just the percentage of time over the entire stroke that we exert a propulsive force. It is related to % recovery time – actually, the sum of the exit, recovery, and catch times – by 100% minus D. A higher duty factor D means a faster recovery as a percentage of the entire stroke’s duration. For our baseline example D = 70%. And if you multiply the average force over the power phase by D you get the average force over the entire stroke. Here, 27.05 lbf times 70% equals 18.94 lbf. Check.
The impulse delivered over a stroke is then defined precisely by
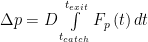
The integral limits correspond to the end of the catch and the start of the exit. This equation is just a concise way of expressing what took us a few paragraphs to explain above. And we finally got to use some calculus. Yay!
Examples
Fig. 6 shows three force curves. Each has the same peak force, 52.4 lbf. The solid line is the force curve for our baseline paddle whose parameters are define in Table 1. The dashed line is the force curve where the power phase is 60% (D=60%) of the stroke period for a 60spm cadence (Tstroke = 1sec). The dash-dot line is the force curve where the power phase is 50% (D=50%) of the stroke period for a 60spm cadence (Tstroke = 1sec). In other words, we move from a 30% recovery fraction to a 50% recovery fraction of the stroke length, with quicker force production.
We compare the impulse generated by each force curve by computing the integral defined above. The integral has units of force times time, and this time we’ll stick to mks units. The impulse quantifies each stroke’s ability to change the hull’s momentum, e.g., impact its speed. The results are listed in Table 2.
Table 2
D = 70%, impulse = 84.22 N-sec

D = 60%, impulse = 72.19 N-sec

D = 50%, impulse = 60.16 N-sec
Table 2 shows that for a fixed cadence, shortening the stroke while maintaining the same peak propulsive force entails lower impulse. Consequently, for a given hull, you go slower with a slower recovery.
How can we overcome this limitation? By increasing the cadence so that each type of stroke provides the same cumulative impulse over a series of strokes, like over a minute or more. In other words, if your stroke generates less impulse you need to up the cadence. While this isn’t news to most paddlers, the analysis tells us why it’s so. And our model lets us determine exactly how much the cadence must increase for equal propulsion. For our D = 60% stroke force curve, cadence must increase by 16.7%, which corresponds 70spm or a 0.86 sec stroke duration. For our D = 50% stroke force curve, cadence must increase by 41.4%, which corresponds to 84spm or a 0.71 sec stroke duration.[6] Each of these results in a duty factor of 70% for a shorter stroke duration/faster cadence. We’ve essentially reproduced our baseline force/stroke duration curve in miniature, just with more repetitions over time.
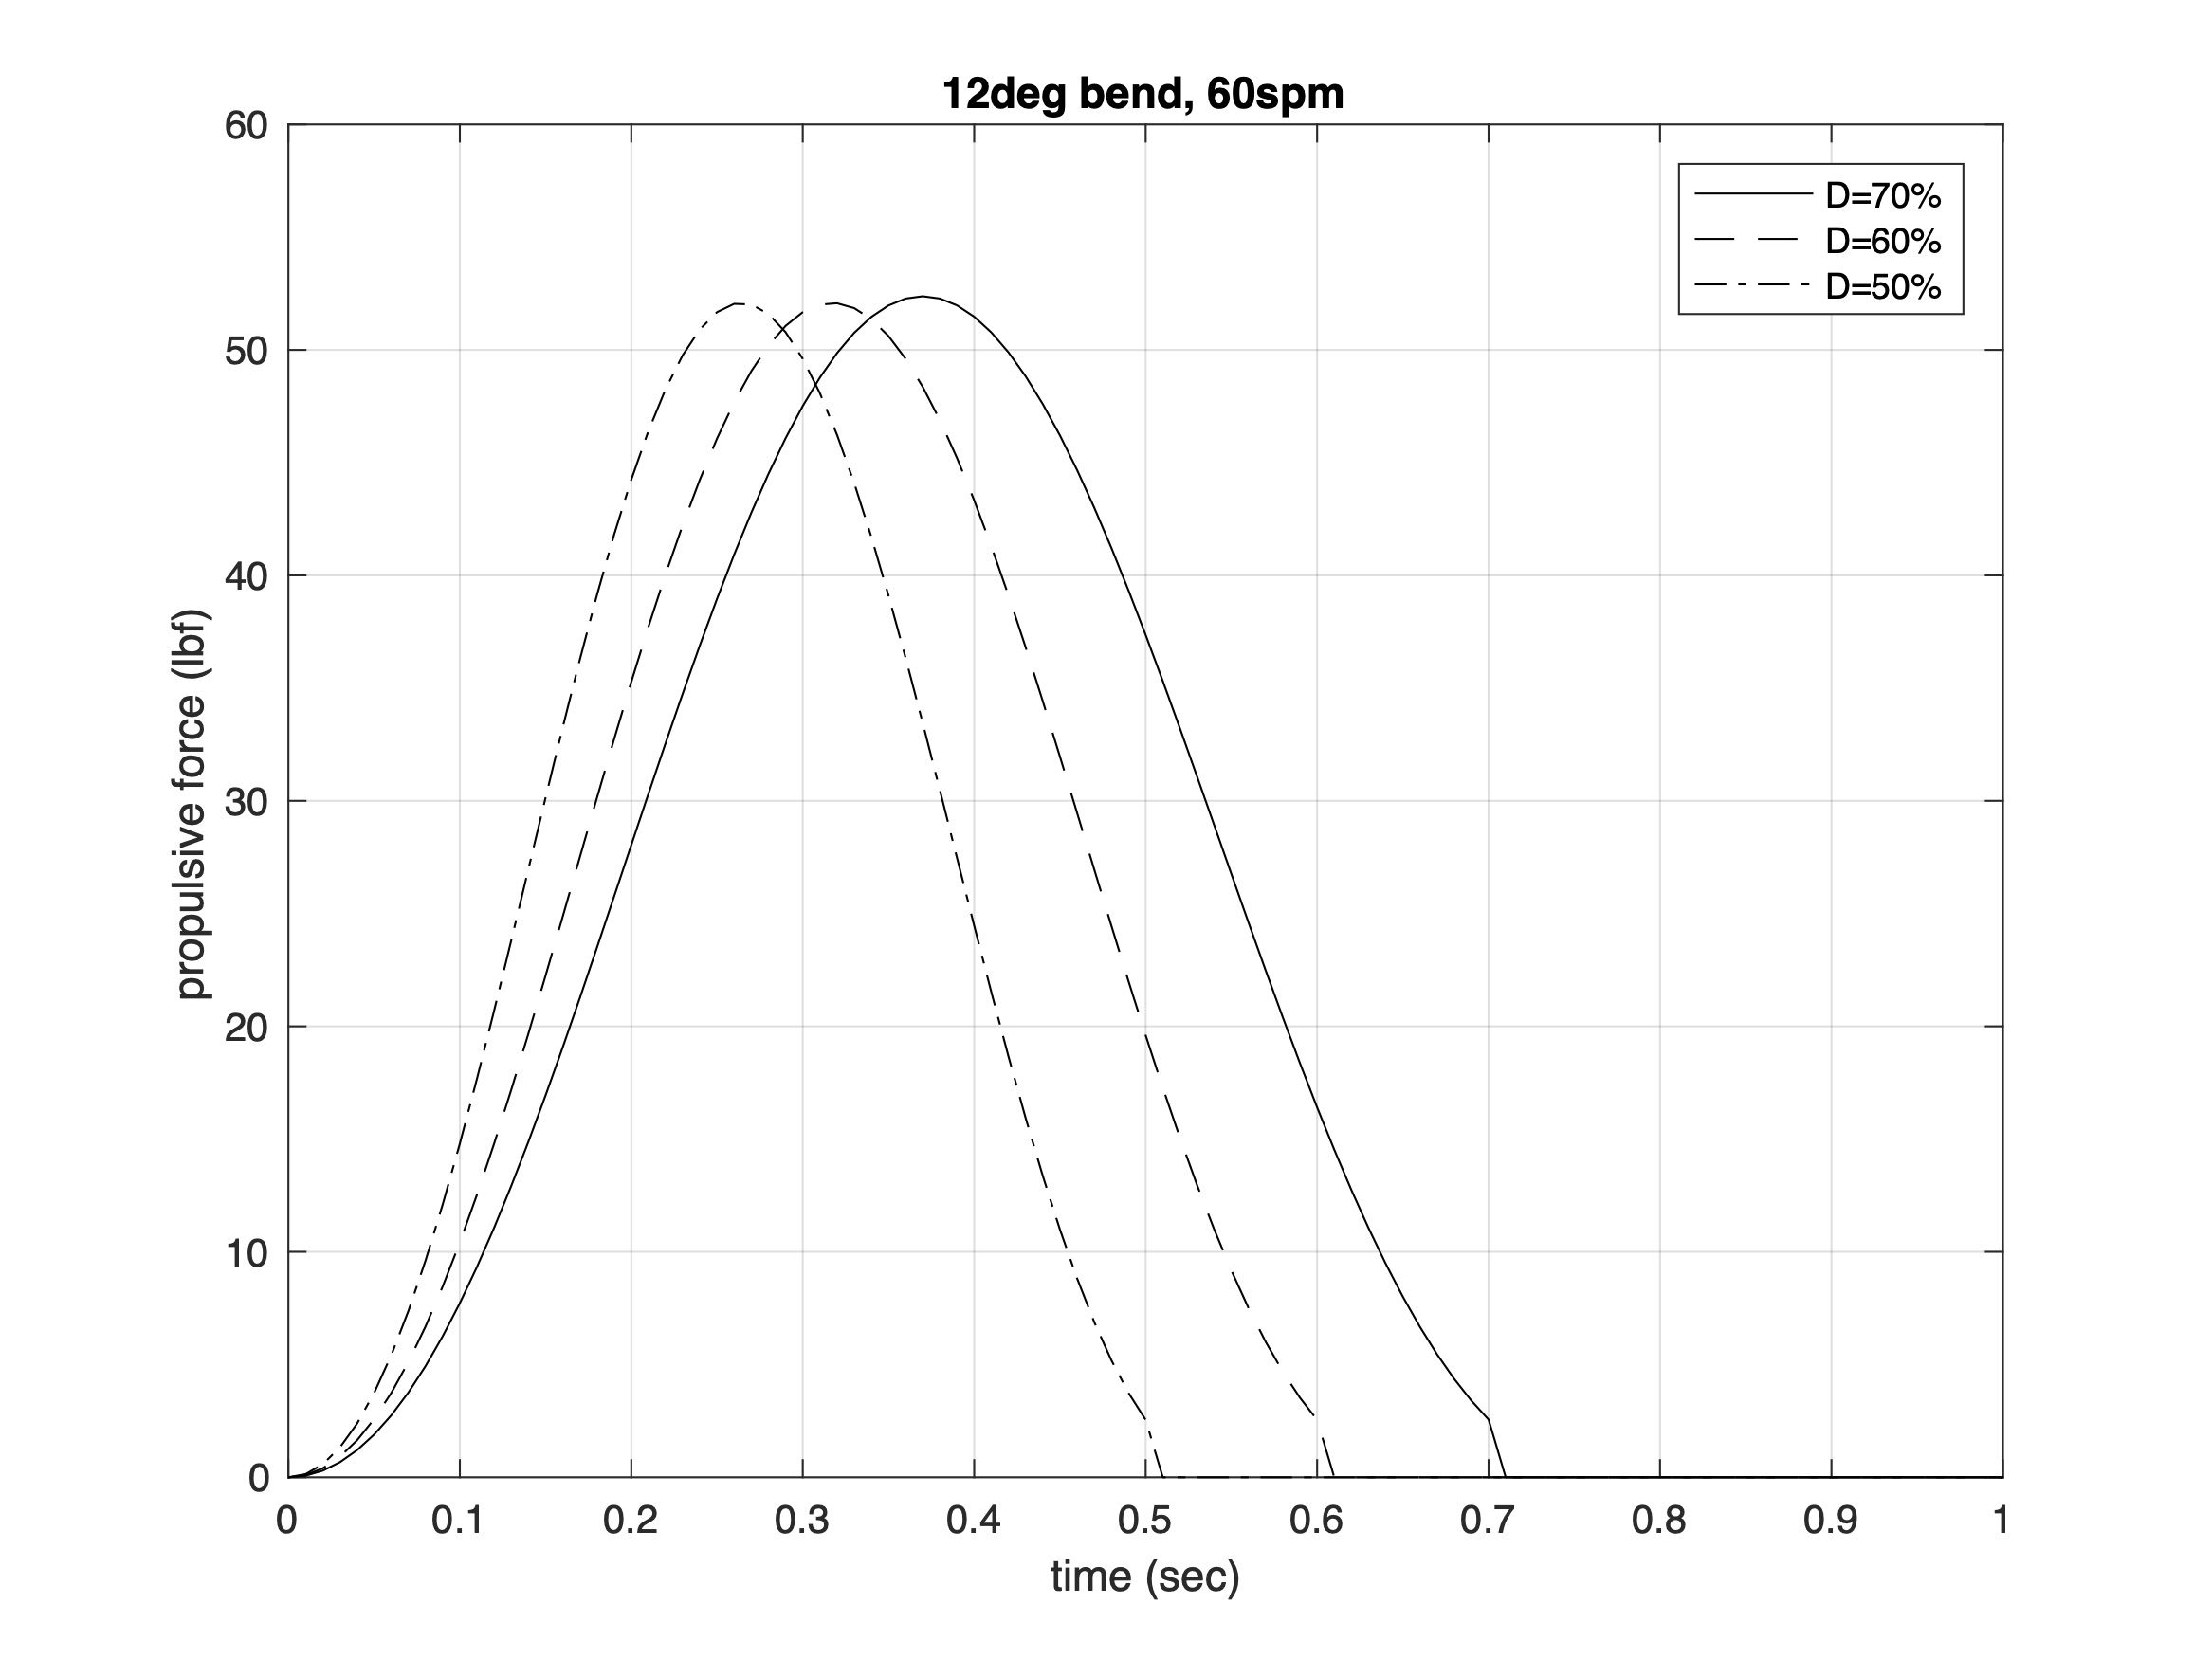
Figure 6: Equal peak force curves with different duty factors.
Alternately, one can keep the force curve shapes and their respective duty factors defined in Fig. 6 and scale the peak propulsive forces. These new curves are plotted in Fig. 7.[7] By scaling the peak forces, for a fixed cadence (here, 60spm) each stroke’s impulse is equal. Consequently, each stroke will equally impact the hull’s momentum and thus its speed. The peak forces for the three curves are 52.4 lbf, 61.1 lbf, and 73.3 lbf, respectively.[8] So if you want a slower recovery for a fixed cadence you need to up each stroke’s peak force.
Figure 7: Varying peak force curves with different duty factors and equal impulse.
Finally, I wondered what happens if we cut a stroke short(er). Our baseline power phase ends with the paddle blade still slightly loaded, as shown in Figs. 1 and 5 above. What happens if we shorten the power phase duration of this stroke (e.g., decrease the duty factor D) for a fixed cadence? This is shown conceptually in Fig. 8. As before the force curve is generated using the baseline parameters from Table 1. The baseline entails an exit at 0.7 sec. The figure also shows force curves with exits at 0.6 and 0.5 sec. How much do we impact the stroke’s ability to propel a given hull with earlier exits?
Figure 8: Baseline force curve with different exits.
We’ll once again compare these scenarios using impulse. The results appear in Table 3.
Table 3
Exit at 0.7 sec, impulse = 84.22 N-sec (100%)

Exit at 0.6 sec, impulse = 80.46 N-sec (95.5%)

Exit at 0.5 sec, impulse = 68.61 N-sec (81.4%)
We see from Table 1 that exiting at 0.6 sec only decreases impulse by 4.5%. To regain the “lost” impulse we must up the cadence from 60spm to ~62.8spm. I for one like an exit where the blade is a bit more loaded. In doing so we haven’t lost much area under the force curve by cutting off a bit more of the force curve’s “tail,” as seen in Fig. 8. That’s the sole criteria for determining and comparing impulse. And the increase in cadence is tiny.
Things get a bit difference when we exit at 0.5 sec. Impulse decreases by 18.6%, which requires upping the cadence from 60spm to ~71spm. Plus, the blade will be strongly loaded at exit. This scenario may be a bit extreme, but it drives home the point that an earlier exit entails cutting off some of the area under the force curve. The earlier the exit, the more impulse we lose.
Extra Credit: Distance per Stroke and Cadence
We’ll examine the role of distance per stroke d via the relation between distance per stroke, propulsive force Fp, and work W. Work is defined as the product of force and distance traveled. In terms of the propulsive force, for each stroke

Consequently, we can write our definition for impulse Dp in terms of work as

This can be rewritten in a (soon to be) convenient form as

Work is also the time integral of paddling power P. As we did for our propulsive force, we’ll consider power to be the average power over a stroke. As a result, the integral becomes the product of average power and the stroke duration,

As we learned in Part 32: Home on the Ranges, when cruising in steady state average power is related to average velocity v via the hull’s drag coefficient CD,

Combining these two expressions yields

Substituting this into our “convenient” result above,
Where we have used the fact that the velocity over a stroke is equal to the distance per stroke d divided by stroke’s duration Dt. Notice how the distance per stroke appears on both sides of this equation. Consequently, we can divide both sides of the equation by d, and solve for the average velocity over a stroke:

Notice how the average velocity does not depend on the distance per stroke. This tells us that distance per stroke is a result of applying impulse through our paddling strokes. Distance does not produce speed. Certainly, we can express average speed in terms of distance per stroke; that’s high school physics. But the distance traveled with each stroke depends on how much “oomph” we apply to achieve a velocity. It also depends on the hull’s hydrodynamics. A sleek, fast hull will run longer per stroke than a less sleek, slower hull.
The expression for average velocity depends on the square root of the impulse Dp. It depends inversely as the square root of the hull’s drag coefficient and the stroke’s duration. The drag coefficient “represents” the hull. A slower hull will have a larger drag coefficient, and the equation shows that a slower average speed. A faster hull will have a smaller drag coefficient, and the equation shows it will have a faster average speed. This reinforces why distance per stroke is a result, not a cause.
As a check on our result, using our expression for Dp in terms of propulsive force and stroke duration, shows

In steady state the propulsive force balances the drag force, which is proportional to the velocity squared times the drag coefficient. This was derived in Part 32. Check!
Take-Aways
- Impulse is a quantitative way to compare the impact of stroke dynamics – force versus time, peak force, stroke cadence, and stroke duty factor – on propulsion.
- For a given cadence and peak force, shortening the stroke’s power phase reduces impulse. You can recover the “lost” impulse by increasing stroke cadence by the inverse of how much the stroke is shortened.
- For a given cadence and force curve, if you decrease the power phase duration you must increase the peak propulsive force to provide the same impulse.
- For a given force curve, you can use impulse to assess the impact of shortening the power phase via an earlier exit. If the area under the “tail” of the force curve is small compared to its entire area, the impact may be negligible.
- Distance per stroke is a secondary (derived) parameter for characterizing propulsion; cadence and impulse are primary parameters.
References
Nicholas Caplan, “The Influence of Paddle Orientation on Boat Velocity in Canoeing,” International Journal of Sports Science and Engineering, Vol. 3, No. 3, pp. 131-139 (2009).
© 2021, Shawn Burke, all rights reserved. See Terms of Use for more information.
- Mass doesn’t have a direction, hence it is a scalar quantity. ↑
- Recall that drag is the combination of friction, form, and wave drag. ↑
- This scaling is used in our MATLAB model to scale the peak force. When equal to one, the resulting peak force is about 52.4 lbf, or 233 Newtons. ↑
- Nicholas Caplan, “The Influence of Paddle Orientation on Boat Velocity in Canoeing,” International Journal of Sports Science and Engineering, Vol. 3, No. 3, pp. 131-139 (2009). ↑
- Unless you’re trout scouting. As downriver paddlers say, “There are two types of paddlers: those who have swum in whitewater, and those who will.” ↑
- These are scaled by the ratios of the duty factors. The proof is left as an exercise to the reader. ↑
- The notation “equal areas” at the top of this figure indicates equal areas under the force curves. ↑
- These are scaled by the ratios of the duty factors. The proof is left as an exercise to the reader. ↑