by Shawn Burke, Ph.D.
INTRODUCTION: PAIN WITH NO GAIN
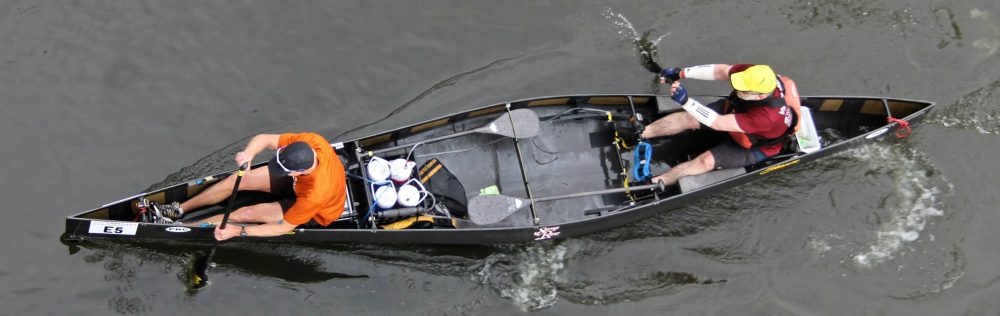
I’m sure some of you have had the following experience at a race: You go out hard at the start, really “putting the coal to it” to hang with the leaders. Then, maybe thirty to forty-five minutes into the race your body says, “No more!” Crash and burn. Coming in to the race you felt well trained; rested; nourished and hydrated; calm and focused. But as you cruise – slowly – into the finish you wonder what the heck just happened?
While there are any number of reasons for this kind of performance – and I’ve experienced ‘em all – you may have been pushing a bit too hard, at an anaerobic pace, and your body just wasn’t able to keep up with its production of blood lactate, hydrogen ions, and the other by-products of muscle metabolism. Remember what we covered in Part 6, What Fuels You?[1] Well your body really does all that stuff. Not only did you crash and burn, but you experienced science!
As we saw in Part 6, the various energy systems – aerobic, anaerobic, and phosphate – are called upon in proportion to the duration and intensity of exercise. The body knows perfectly well when it is performing aerobically or anaerobically. How do we know whether our workouts are aerobic, anaerobic, or somewhere in between? And what can we take from this to help understand how hard to go during a race?
In this installment of The Science of Paddling we’ll explore a way to measure paddling intensity and determine whether your body is performing aerobically, anaerobically, or “somewhere in between.” In particular we’ll focus on a way to determine, using a paddle ergometer and a heart rate monitor – in the comfort of your own home gym[2] – the transition point called the “lactate threshold” above which your body is unable to keep up with the production of lactate. Think of it as the red line on a car’s tachometer. Once you exceed the threshold and stay above the red line, the clock starts ticking until you flame out.
Much of what follows may be well known to runners and cyclists. We’ll assume that you’re familiar with the use of heart rate as a measure of exercise intensity; the harder you work, the faster your heart beats. For sports such as running the relationship between heart rate and intensity is pretty much linear up until the lactate threshold; if you increase your speed by a certain amount your heart rate will rise in direct (aka, linear) proportion. But as we learned in Part 1: Tandem vs. Solo, at racing speeds the drag force on a hull is proportional to the square of speed. It’s not a linear function. As a result, the work you expend paddling a hull increases nonlinearly with speed, too; it not only gets harder, but it gets harder fast. As we’ll see, this complicates things a bit if you want to determine your lactate threshold, since tests that don’t rely on taking blood samples to directly measure blood lactate concentration generally assume that this relationship is linear. Which is where the physics of paddling comes to the rescue.
Now we could dive right in to a prescription of how to measure your lactate threshold for paddling, and if that’s what you want please feel free to skip ahead to the section titled “The Deflection Point and Lactate Threshold.” But since many readers may be less familiar with the minutia of heart rate data and blood lactate concentration you’ll find a review of these topics in the next two sections. Then, we’ll use these tools to understand heart rate data obtained in a so-called “step test.” You get to be a paddling scientist in the comfort of your own abode.
HEART RATE
The body’s circulatory system transports oxygen and glucose to muscles during exercise and removes the waste products of exercise such as muscle-generated heat, carbon dioxide, water, hydrogen ions, and adenosine. These metabolic byproducts cause the capillaries to expand, enabling the heart to deliver more oxygenated blood to the muscles[3]. At rest the heart pumps about 5 liters of blood per minute. As you begin to exercise the autonomic nervous system tells the heart to beat faster. At maximum output the heart of a highly trained athlete can pump as much as 40 liters per minute.
As noted above, there is a relationship between heart rate and exercise intensity. Consequently, heart rate is commonly used as a measure of exercise intensity, as well as for planning a targeted training program. The maximum and resting heart rates are of particular interest, as these are used to prescribe training zones, track the progress of your exercise program, and monitor recovery from workouts.
Everyone has a maximum heart rate (HRmax) that does not change appreciably with endurance training. The maximum heart rate does, however, decrease with age. It is difficult to determine HRmax without directly measuring it. However, HRmax can be approximated via
HRmax ~ 205 – (age ÷ 2) for men,
HRmax ~ 210 – (age ÷ 2) for women.
According to this formula, a 44-year-old woman has a maximum heart rate of 210 – (44÷2) = 188 beats per minute (bpm). Note that an athlete’s true maximum heart rate can differ significantly from what is predicted by this simple formula, so it is best to actually measure HRmax if at all possible. We’ll see how to determine HRmax more precisely using a heart rate monitor during a threshold workout or race.
A chest strap heart rate monitor is a most convenient tool for measuring your pulse[4]. These devices consist of a sensor, a transmitter, a receiver, a little computer, and a display. Sensing electrodes are located on the chest strap. These electrodes measure electrical activity in the body when nerves fire to make the heart beat. A transmitter in the chest strap sends this information to the receiver using a low-power radio signal. The receiver can be built into in a plastic watch housing and worn on the wrist, or mounted on a thwart, bulkhead, or the like. The wrist unit displays heart rate; more advanced models can also measure speed and distance using other sensors such as GPS or accelerometers.
You can measure HRmax accurately in the field using a heart rate monitor. Here are two methods:
- Threshold Test: First, you must be fully recovered from any earlier anaerobic workouts or races, and well rested. The test begins with a warmup of 15 to 20 minutes, with gradually increasing intensity. This is followed by an all-out effort of 20 minutes. The level of effort during the last 4 to 5 minutes should be maximum. The final 30-60 seconds should be an all-out sprint, and you should feel that there is nothing left in the tank at the end. The heart rate reached over this final 30 seconds will be very close to HRmax, usually within 2 bpm or less.
- Race Test: At the end of a 5-kilometer to 10-kilometer race, finish the event with a kick of 4 to 5 minutes. The final 30-60 seconds should be an all-out sprint, and you should feel that there is nothing left in the tank at the finish line. The heart rate reached over this final 30 seconds will be very close to HRmax.
An important caveat about HRmax is that it is sport specific. HRmax for running generally will be higher than HRmax for paddling, cycling, or swimming; differences of 10bpm to 15bpm are common. This variation in HRmax can be attributed to the differing mix of muscles engaged for running, paddling, swimming, cycling, etc. For example, it is estimated that a paddler uses 85% of the muscle engagement of a runner. This is because a paddler’s body is supported against gravity by the canoe (a “weight supported sport”), and the paddler’s legs are only performing isometric contractions during the leg drive. Since HRmax is used to plan training, if you are a multi-sport athlete it should be measured for each sport using the methods outline above.
So why do we care about HRmax? Because every paddler’s HRmax will be different, for starters. I’m always amused at races when I hear someone say, “My heart rate got up to 175!” Well, OK; is that good or bad? Does it mean they were working really hard, or not? Unless we know what that person’s maximum heart rate is the number is meaningless. Further, since most training prescriptions based on heart rate are expressed as a percentage of HRmax, knowing HRmax sounds like a good thing.
Figures 1 and 2 are sample heart rate records plotted over time. The first shows heart rate as a percentage of HRmax over a 55-minute race. Nearly steady-state heart rate is reached in about 3 minutes, reflecting how long it takes for the aerobic system to fully engage. There was a buoy turn on the course at the 19-minute mark; note the increase in heart rate as the paddler makes the turn and briefly accelerates. Otherwise heart rate is fairly uniform, reflecting a constant effort throughout the event. Heart rate rises during the finishing kick, reaching 98% HRmax at the finish. It turns out that the steady-state heart rate during this race, 89% HRmax, was likely very close to this paddler’s lactate threshold. And as we’ll learn below that’s a very good thing for such a race length.
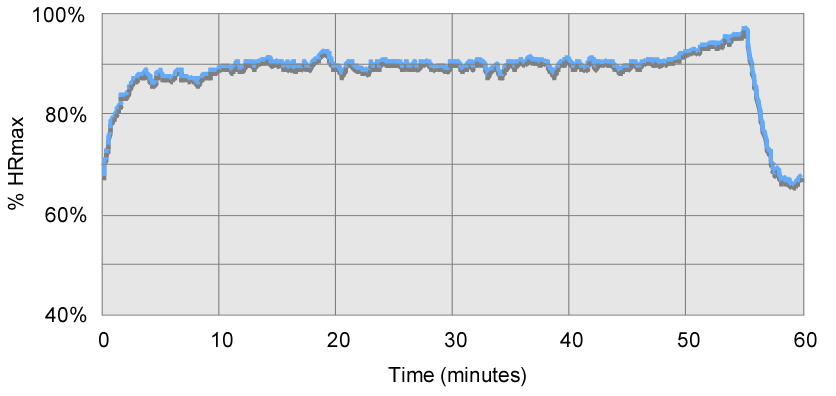
Fig. 1: Heart rate plot for 55-minute race.
Figure 2 plots heart rate as a percentage of HRmax of a canoeist paddling at a constant level of intensity (e.g., pace). Note how the heart rate increases over time during the work interval. This phenomenon is called heart rate drift. Heart rate drift in fit athletes can be attributed to increases in core temperature, or on long races to dehydration – with less blood volume, the heart has to pump harder to supply the muscles with oxygen and remove waste products. In really long races heart rate can even drift downwards at a constant level of effort.
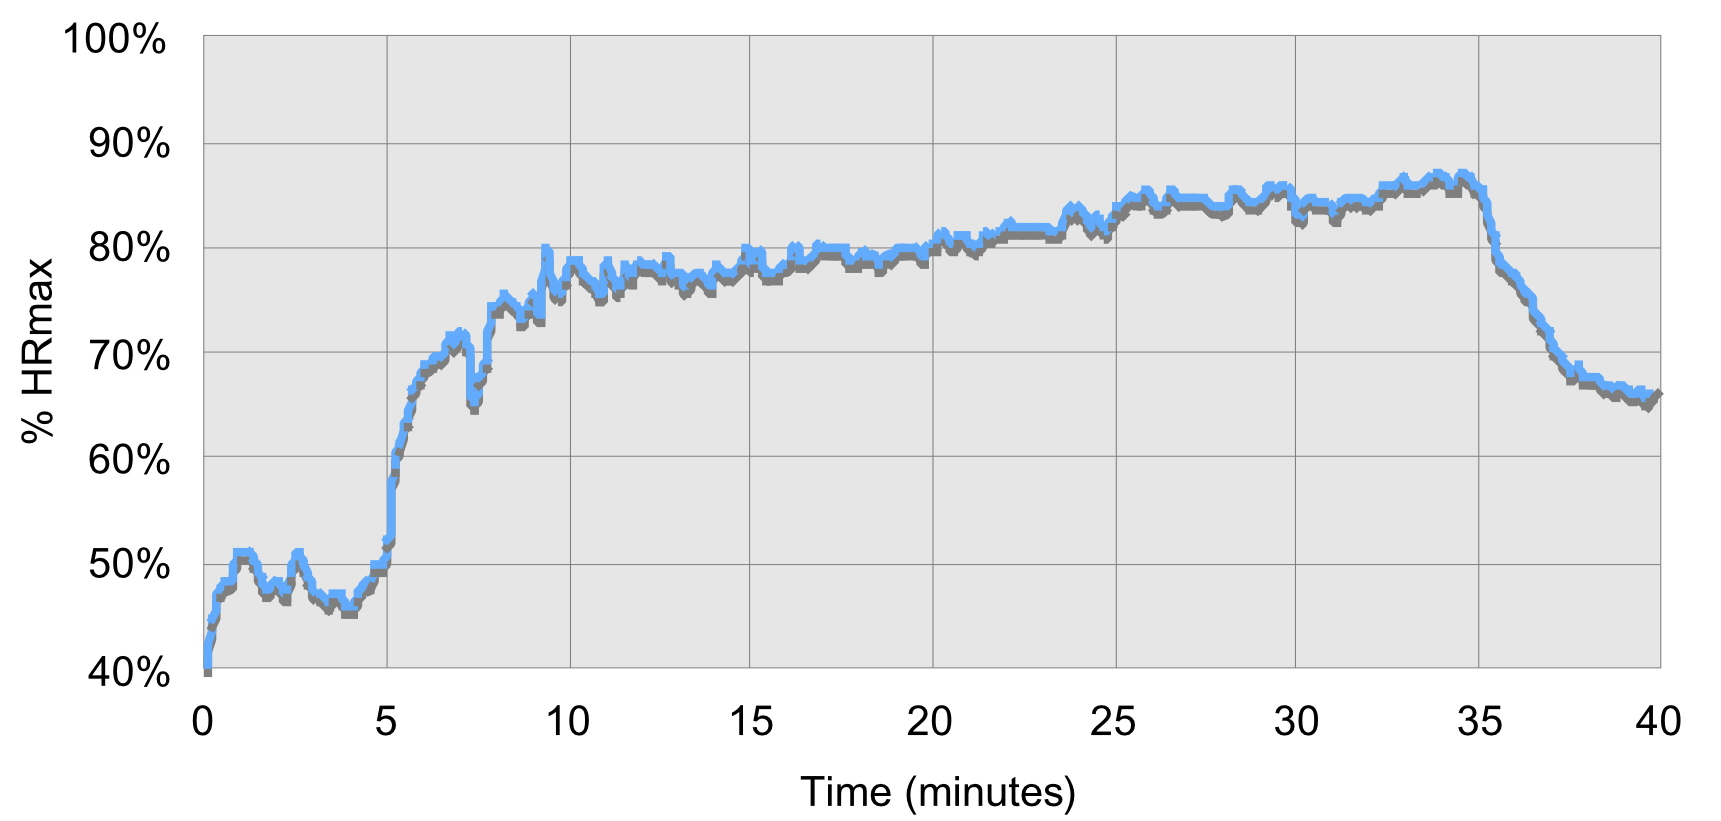
Fig. 2: Plot showing heart rate drift.
Trained endurance athletes have a lower resting heart rate (HRrest) than untrained individuals. The average person’s resting heart rate is between 70bpm and 80bpm. As fitness increases HRrest gradually decreases. A well-trained athlete can have a resting heart rate as low as 40bpm to 50bpm. This is due in part to conditioning-based changes in the heart. Endurance training increases the heart’s stroke volume, hence it can pump more blood per beat. Also, the muscles’ metabolic systems become more efficient with training, requiring less oxygen at rest.
You should measure resting heart rate in the morning, right after you wake up. Studies have shown that HRrest is generally lower in the morning than in the evening[5]. You can go so far as to use your heart rate monitor to measure HRrest. However, manually measuring the radial pulse will suffice. An obscure but true fact is that your heart rate will be elevated by around 2-3 bpm if you need to go to the bathroom. So if you need to pee when you wake up do so, then climb back into bed. Your heart rate will settle back down in a few minutes and you can get a more accurate reading of HRrest.
Some people count their pulse over ten seconds and multiply the result by 6 to get their heart rate in beats per minute. Taking your pulse over a full minute will increase accuracy; if you miscount your pulse over 10 seconds by one beat, your estimate of HRrest will be off by 6 bpm. Are you really in such a hurry that you need the extra 50 seconds in your day? As you take your heart rate you will notice that your pulse increases when you breathe in, then decreases when you breathe out. This phenomenon, called heart rate variability, is perfectly fine normal reflects a healthy heart. Just breathe normally and take your pulse over a full minute.
It is a widespread myth that HRrest is itself a measure of an athlete’s fitness. Rather, gradual systematic decreases in HRrest over months and years reflect improved conditioning. More importantly, HRrest is an important indicator of recovery from the previous day’s workout or race. If HRrest is elevated, say by 5bpm compared to the usual baseline established over time, then recovery may be incomplete; you should consider substituting a recovery workout for that day’s training. The morning pulse should recover to baseline by the next day. Increases in HRrest that do not go away can be an early indication of overtraining, stress, or looming viral infections (e.g. colds, the flu).
An example of how the resting heart rate can change over time is shown in Figure 3, a plot of my morning rest heart rate over one week. Back when I took this data my resting heart rate was 54 bpm. Note how HRrest rose by 8 bpm when I was fighting a cold on Tuesday and Wednesday, then returned to normal levels after the cold had passed. The elevated resting heart rate on Sunday was the result of a hard 2-hour overdistance workout on Saturday.
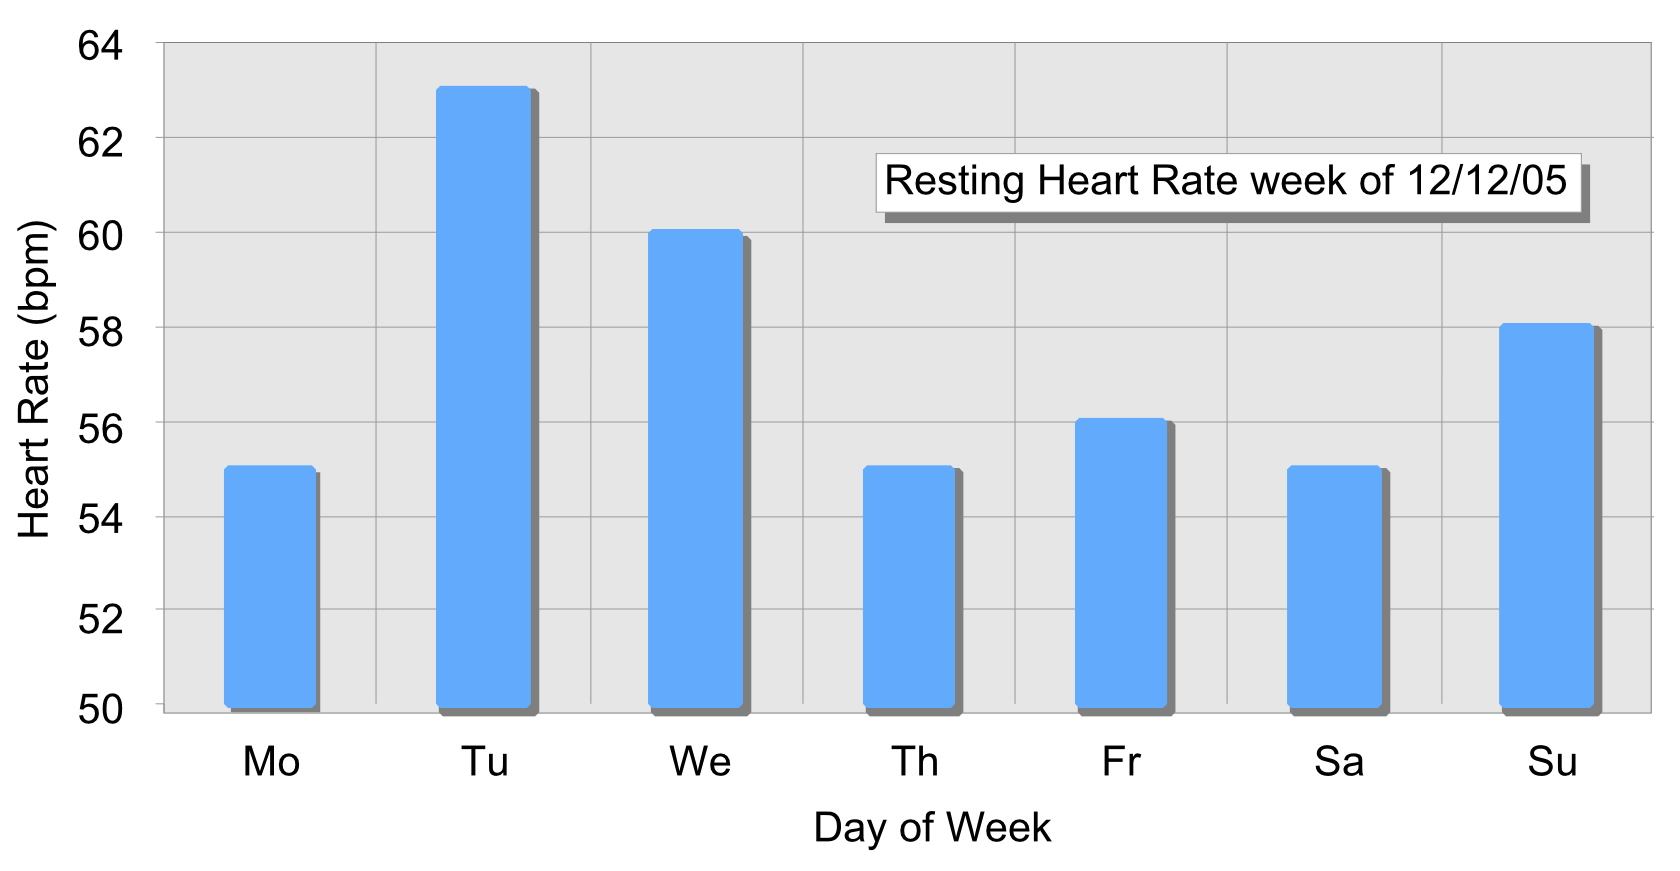
Figure 3: HRrest over time.
LACTATE
As you exercise your glycolytic system produces lactic acid. Before a training session most paddlers have a blood lactate concentration of approximately 1.5 millimoles per liter (mmol/l). Once you start paddling aerobically the concentration drops below 1.0 mmol/l, and as you continue to paddle it will rise depending on the level of effort.
The relationship between blood lactate production and exercise intensity has both linear and non-linear components, as shown conceptually in Figure 4. This relationship is fairly linear below a lactate concentration of 1.5 mmol/l, then starts to bend sharply upward as the concentration approaches 4.0 mmol/l. The 4.0 mmol/l blood lactate concentration point – often called the lactate threshold – is of great interest here, since it occurs at roughly the transition point between aerobic and anaerobic metabolism. A rule of thumb is that you can race continuously at the lactate threshold for about an hour before flaming out; less if you race harder; longer if you periodically drop down below the lactate threshold to recover (like when doing intervals, or dropping in behind a boat to stern wake).
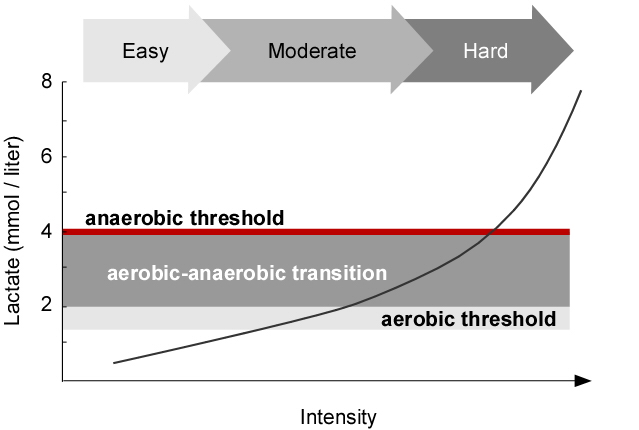
Figure 4: Blood lactate concentration as a function of exercise intensity.
The blood lactate vs. exercise intensity curve will shift to the right as you become more fit. This is because with increasing fitness your aerobic system will be able to clear the metabolic byproducts of exercise more efficiently. The glycolytic system and the Cori cycle will become more efficient as well, especially after anaerobic training such as tempo paddles, hard intervals, and racing. With this kind of training you’ll be able to paddle harder for longer periods of time because your lactate threshold will shift to increasingly higher exercise intensities.
This training effect makes the determination of metabolic training zones and zone boundaries problematic, since they shift with your changing fitness level. The only truly precise solution is to periodically measure blood lactate production as a function of workout intensity. While not practical for most of us, they may work for a paddling club or team.
Blood lactate can be measured by taking a drop of blood from a fingertip or ear lobe much the same way diabetics monitor the level of blood sugar. Samples are taken during exercise at specified intensities and plugged into the analyzer, whereupon your blood lactate concentration corresponding to that intensity is measured and displayed. Portable analyzers like the Lactate ProTM, shown in Figure 5, the Lactate Scout, etc. enable paddlers and coaches to accurately determine blood lactate levels in the field to precisely determine individualized metabolic training zones. They are the gold standard.
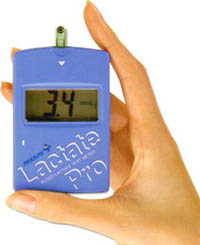
Figure 5: Lactate ProTM portable blood lactate analyzer.
Other products have been introduced over the past few years that use near infrared spectroscopy to determine blood lactate concentration, such as the BSX Insight (which was recently discontinued). However, this product only provided a blood lactate measurement using post-processing at the company website, and it was designed for use in running and cycling. Consequently, the rest of us are left with indirect methods for determining the lactate threshold.
THE DEFLECTION POINT AND LACTATE THRESHOLD
The relationship between blood lactate production and exercise intensity is non-linear, especially at higher levels of effort. We saw that the lactate concentration vs. exercise intensity curve, Figure 4, has a “knee.” And we also know that for paddlers there is a nonlinear relationship between heart rate and exercise intensity. (We engineers just love this kind of stuff…) With a little tinkering, you can take advantage of these facts to determine non-invasively an important blood lactate concentration level and its associated heart rate.
The heart rate deflection point (HRdefl) is defined as the heart rate above which the accumulation of lactate exceeds its recycling by the liver. This corresponds to the lactate threshold of 4.0 mmole/l blood lactate concentration. A fit paddler can perform at the intensity level corresponding to HRdefl for a long period of time, as there is equilibrium between lactate production and removal; a rule of thumb is that a fit endurance athlete can perform at HRdefl for about an hour. There is a good correlation between the anaerobic threshold and HRdefl. Once you know your lactate threshold heart rate you can determine your lactate threshold pace by paddling at HRdefl and noting your pace on a GPS sports watch; easy peasy. And most importantly, this pace corresponding to HRdefl can be increased through training.
Italian physiology professor Francesco Conconi developed a means to non-invasively measure the lactate deflection point; otherwise, to date blood samples have to be taken to determine the heart rate and exercise intensity at which blood lactate concentration reaches lactate threshold. The so-called Conconi Test maps heart rate vs. exercise intensity at a number of intensity levels, e.g. at a number of pace/speed set points. For runners, the plot of heart rate vs. pace will initially have a generally linear trend, as shown in Figure 6. At the deflection point the heart rate versus intensity plot curves downward – what mathematicians call an “inflection point.” The aerobic system – which is based upon the heart’s ability to deliver oxygen and remove lactate – can no longer “keep up” with higher intensities, and the energy mechanism transitions from aerobic to anaerobic metabolism. This knee in the curve corresponds fairly well to the 4.0 mmol/l blood lactate threshold.
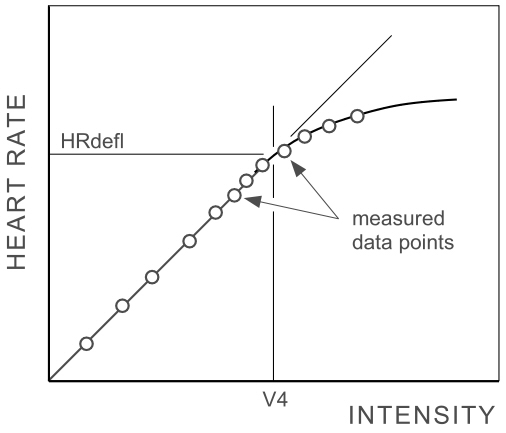
Figure 6: Idealized Conconi Test plot.
The Conconi test can be conducted on a paddling ergometer equipped with a performance meter like that shown in Figure 7. You’ll also need a heart rate monitor, a sports watch that can be programmed to create custom workouts, and software that can average heart rate data, plus software like Excel that can plot and perform basic mathematical computations. You must also be fully recovered from any race, interval workout, long paddling session, etc. before your start. Check your resting heart rate, for example, to be sure.
The process is pretty straight forward, but expect your first test to be a learning experience as you experiment with the ergometer’s damper setting, starting pace for the first step, and the number of steps. Once you have all of these parameters sorted you can repeat the test every 4-6 weeks to assess the impact of your training program on (potential) race pace. Just note that for the step test to be a valid indicator of training progress, it must be conducted under identical conditions each time.
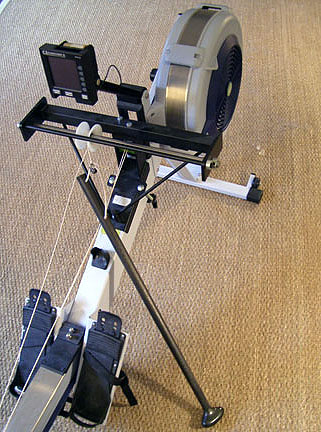
Figure 7: Paddle ergometer with performance monitor.
If you are using a Concept 2™ rower, set the damper to 2 or 3; this will take a bit of experimentation. An extensive warm-up of 15 to 20 minutes is followed by a “step test.” During this step test the pace is decreased at regular intervals, approximately 10 times, as defined in Figure 8. Program your sports watch to do an interval workout[6] comprising: (1) a 20-minute warmup of gradually increasing (but still easy) intensity, followed by (2) ten to twelve 2-minute segments with no target pace or heart rate (and no recovery phase), then (3) a 5-minute cool down. The first step is done so that you finish at a pace corresponding to 55-60% HRmax; for me this was 3:00/500m; your pace may be different. After reaching each step’s target pace keep your pace constant for 2 minutes. This will take a fair bit of focus and concentration. Record your heart rate over the entire test with a heart rate monitor.
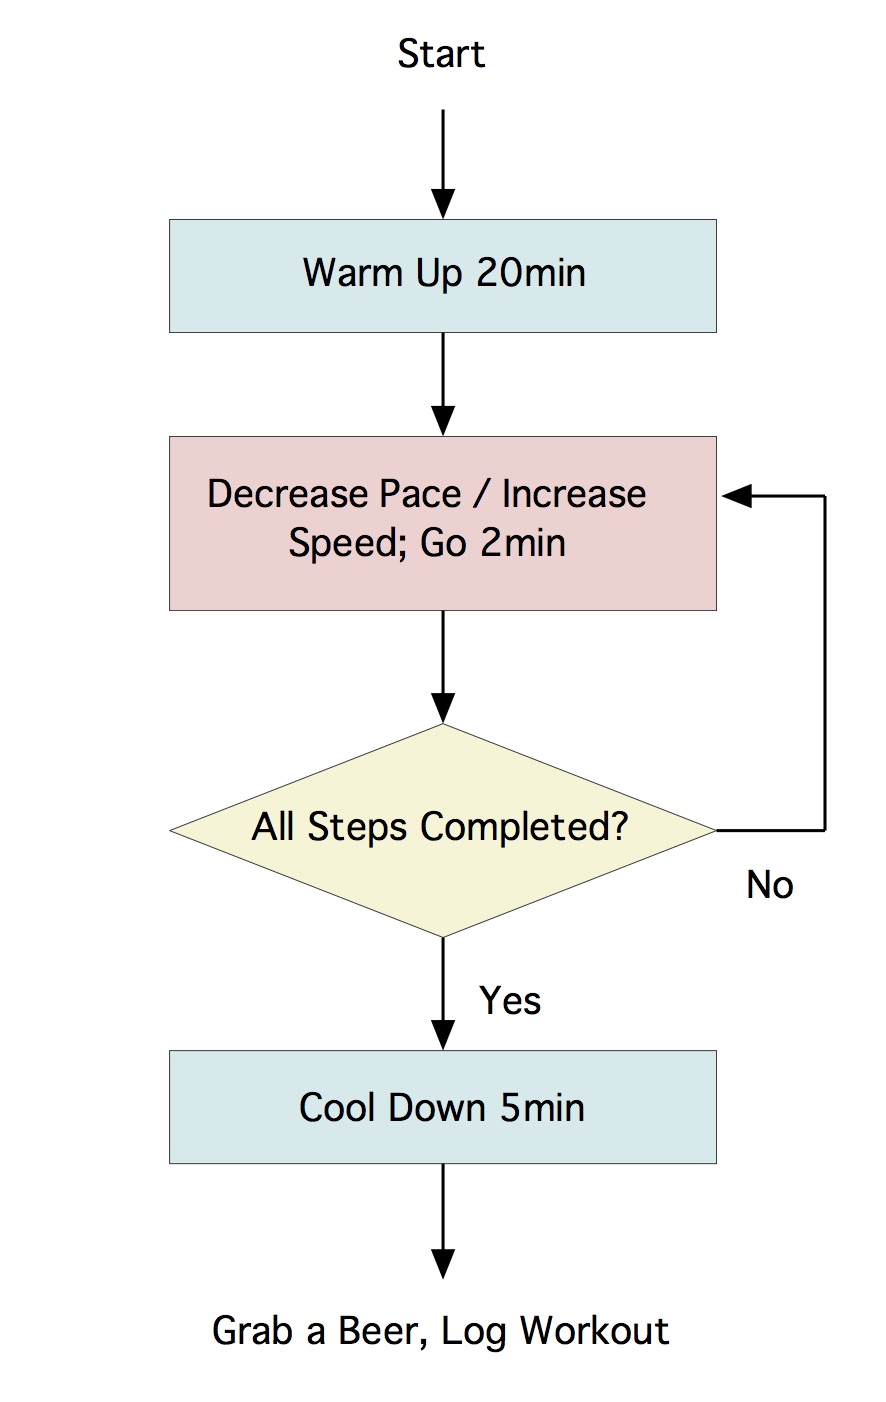
Figure 8: Conconi Test logic.
The pulse over the last minute of the step is the steady-state heart rate for that pace; the heart rate needs a period of time to adapt to the new speed over a step as seen in Figure 9. In this Figure you see that the heart rate spends most of the first minute rising, then is fairly level through the rest of the two-minute segment. For analysis you can either average the data over the last minute, or over the entire segment; just be consistent. If you choose the latter your lactate threshold heart rate estimate will be a couple of bpm low.
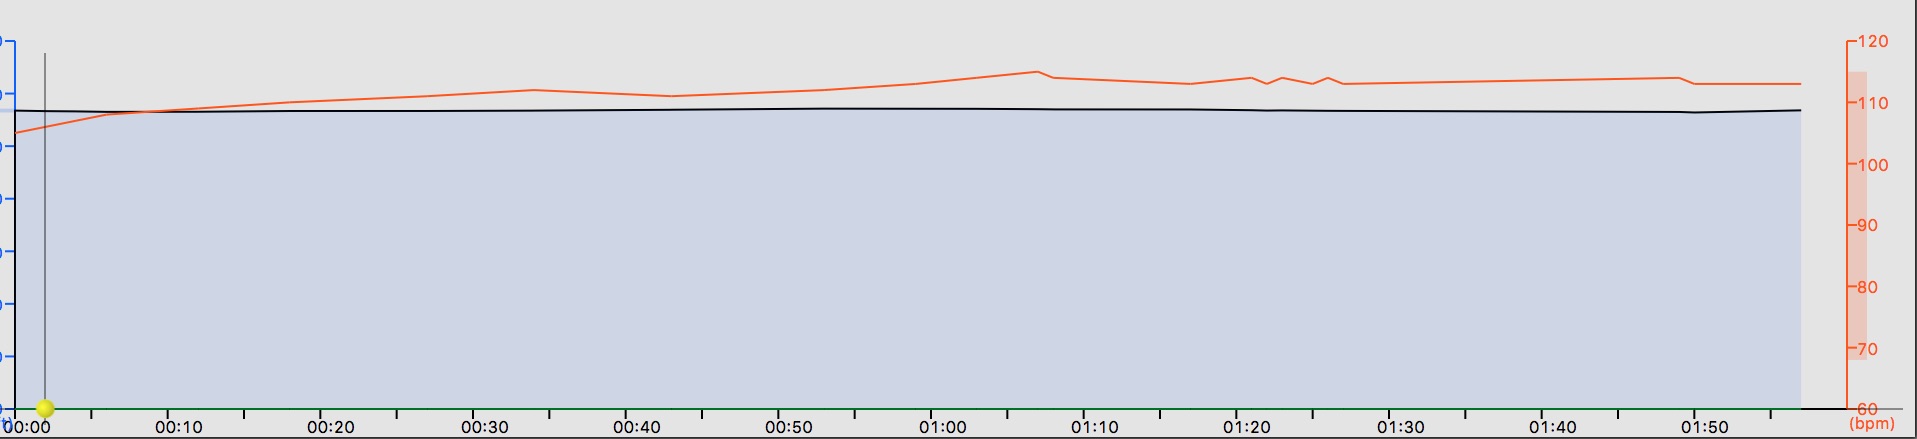
Figure 9: Heart rate (red trace) drift over a 2-minute segment.
Pace is incrementally decreased by 5sec/500m for each segment, and data points recorded until points are logged at and above the anaerobic threshold, typically somewhere around 90-94% HRmax.
When I plotted average heart rate data vs. step from my own step tests I noted something odd. You’ll see the data in Figure 10. The heart rate data doesn’t fall on a straight line before it (apparently) curves off to the right. Instead, it exhibits a bit of a curve. For comparison, I plotted a red dashed line where I tried to find a linear behavior among some of the upper points, and a green dashed line where I looked for that kind of behavior among the lower points. While you might argue that the curve “deflects” at the 8th segment, you’d be hard pressed to justify that choice. Why not the 7th? Or the 9th? Also, why is it bowed along the lower 8 segments?
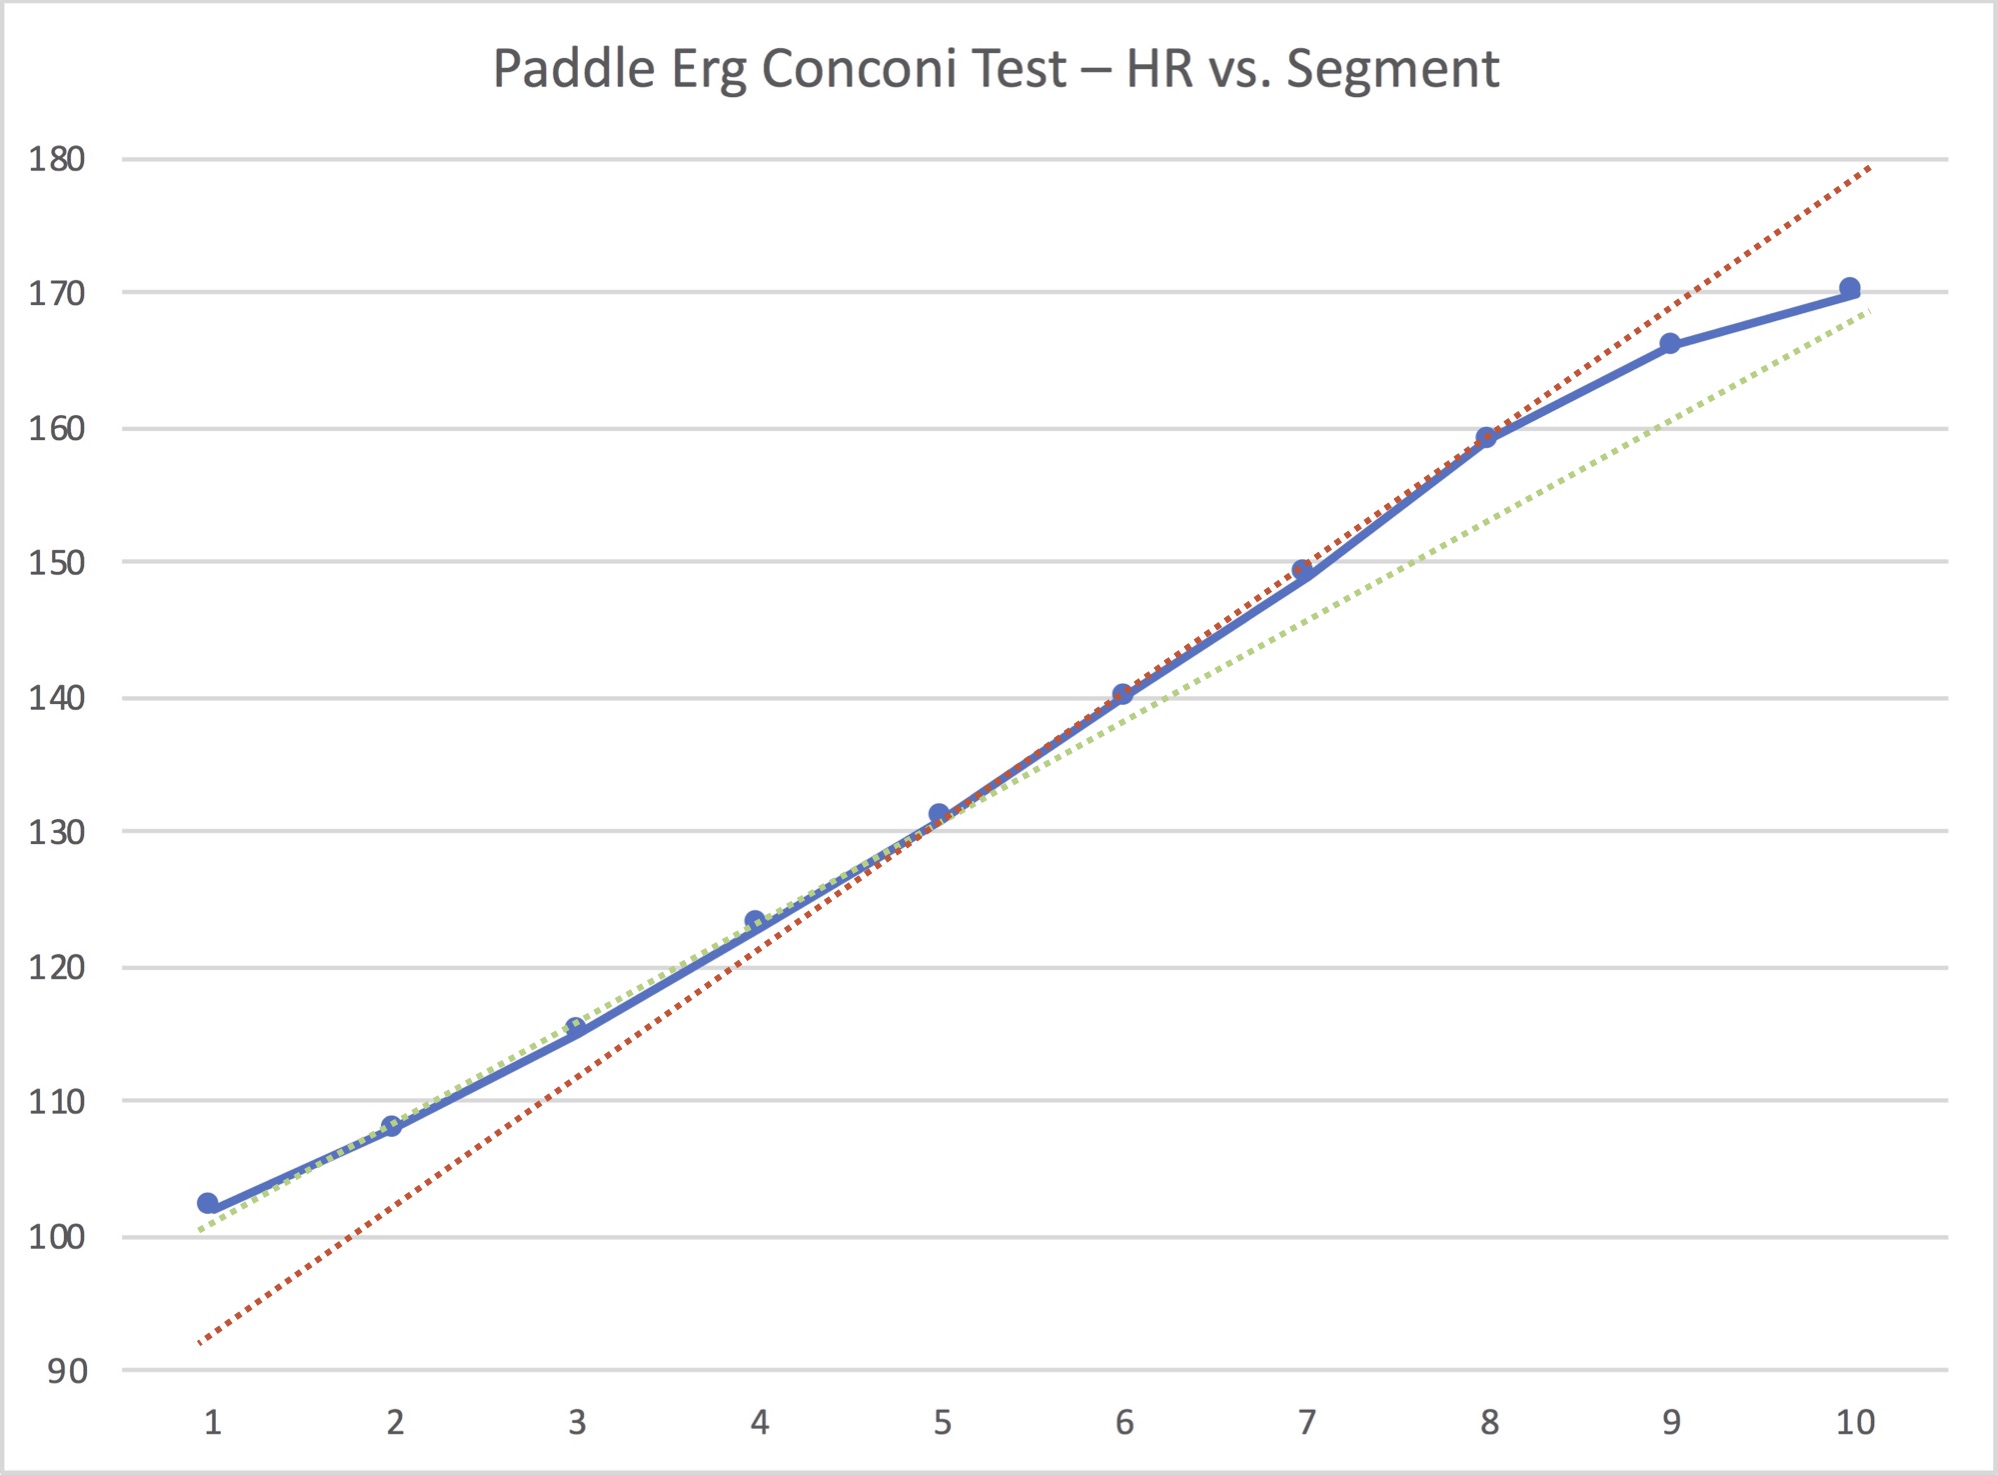
Figure 10: Heart Rate vs. Segment (blue trace).
Well; duh. Physics! As we learned in Part 1, the resistive force on a hull goes as the square of the velocity at race paces. This means the resulting intensity should show that kind of quadratic behavior as well.
This is where high school algebra helps us. As you may recall there was this function called a logarithm. Logarithms were invented by a fellow called Napier back in the 1800s to aid in computing the products of large numbers, among other things. He developed a mechanical means to perform these computations, the forerunner of slide rules.[7] Since then several other interesting properties of logarithms have been deduced. Namely, taking the logarithm of any function that is expressed as the power of a number reduces to a simple linear form:
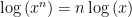
That is, something that showed a quadratic (or any other power) form when plotted would now take a linear form if you plotted its logarithm instead.[8]
Armed with this insight, I used Excel to calculate the natural logarithm (“ln”, or “loge”) of my heart rate data, and re-plotted the data. The result is shown in Figure 11.
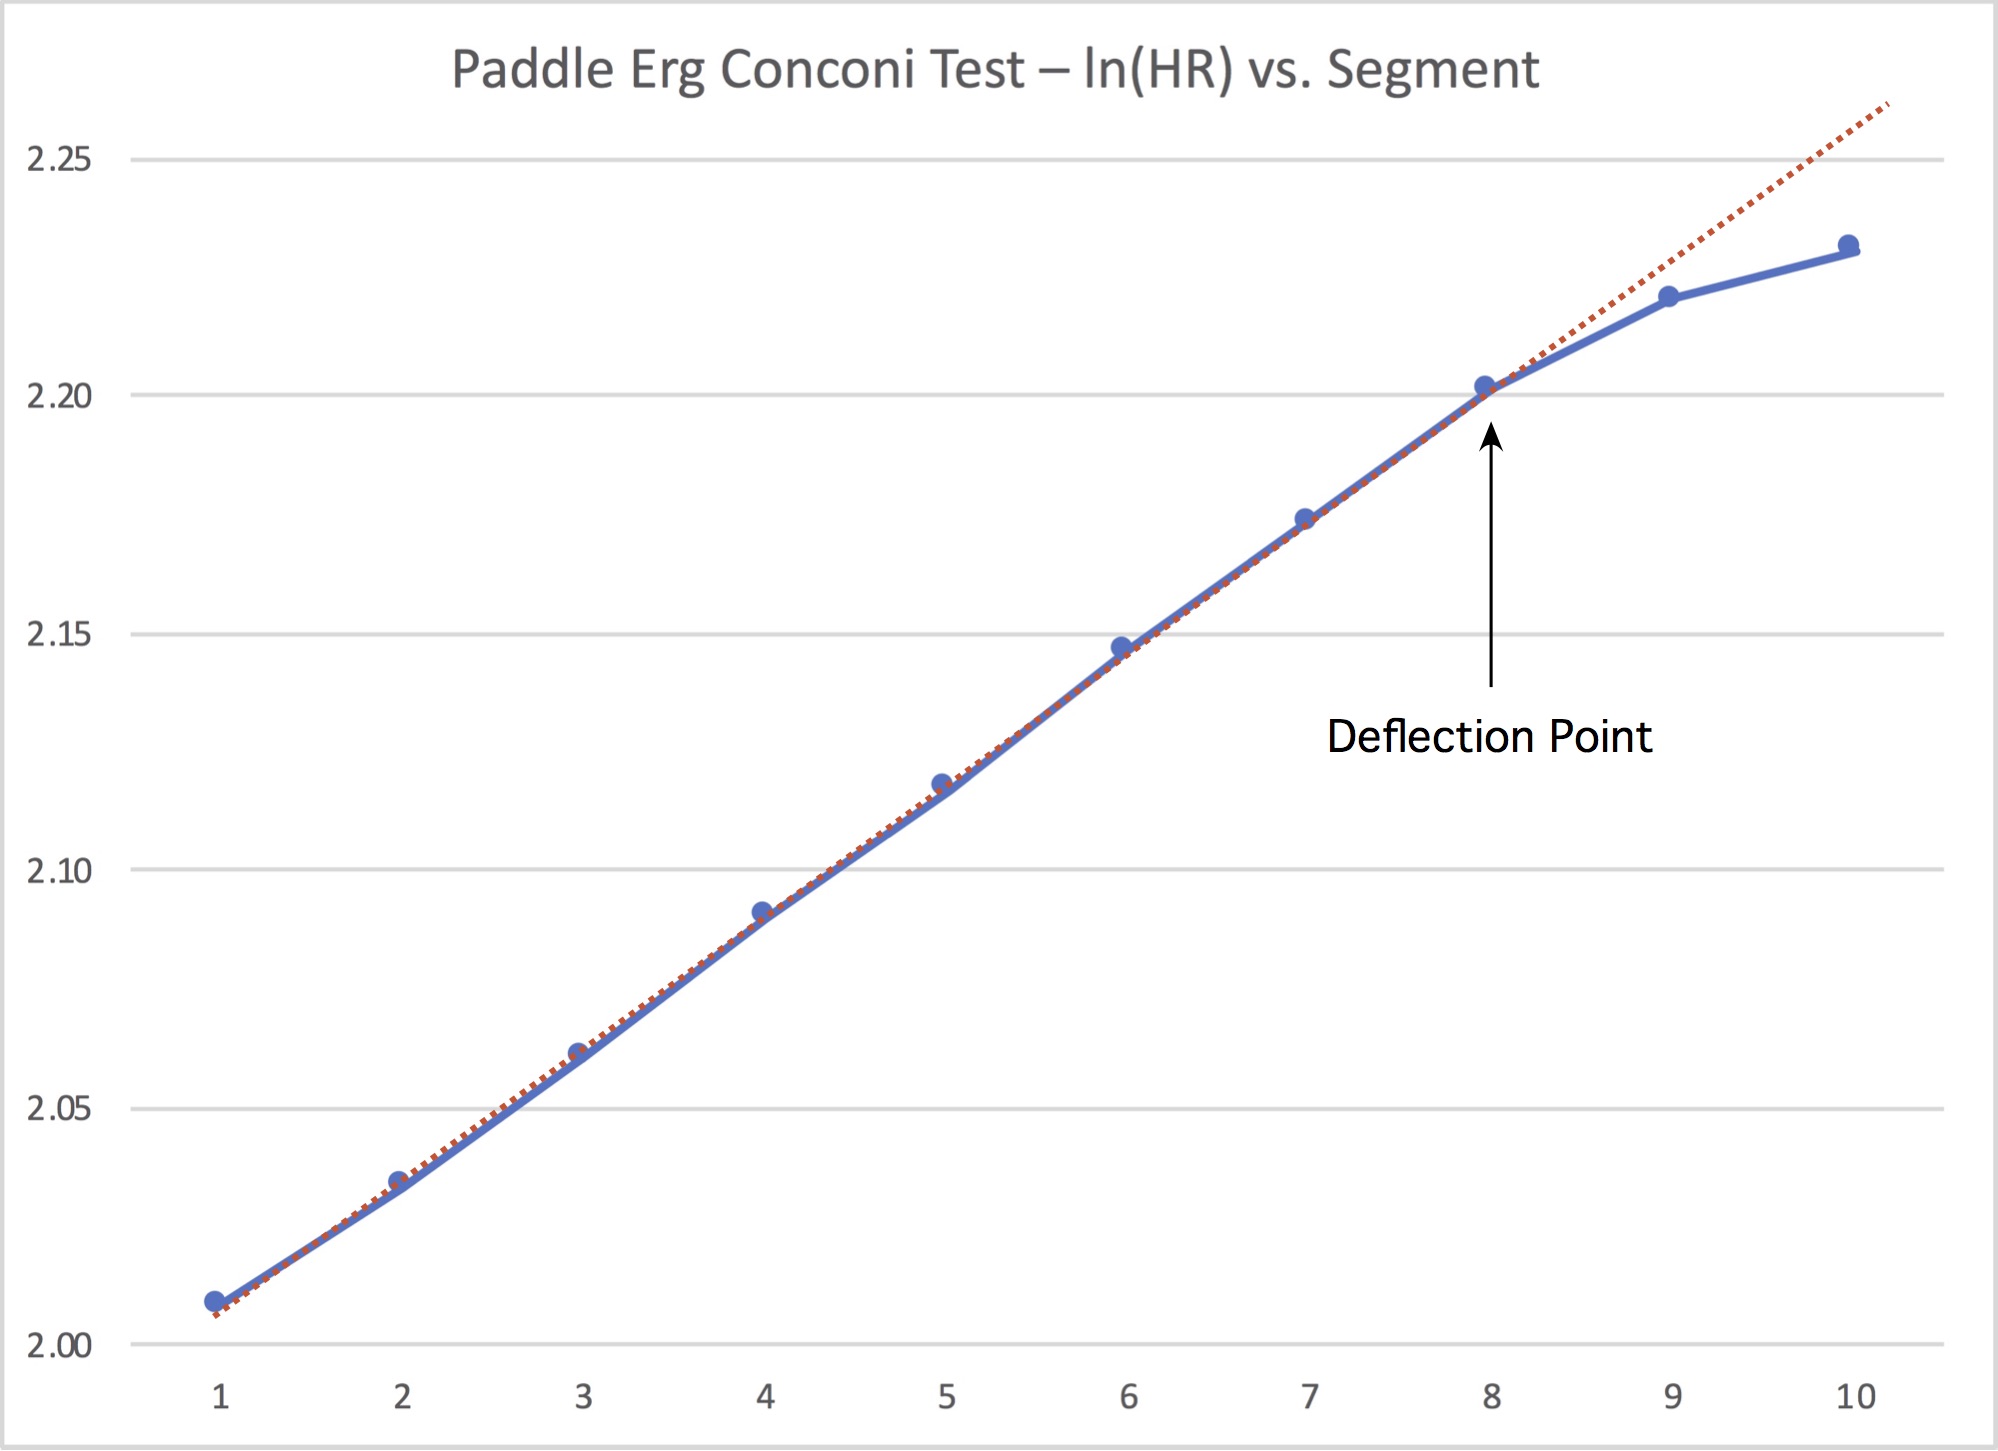
Figure 11: Loge(Heart Rate) vs. Segment.
I added a straight line fit to the lower data points, which now looks to be a good fit. And the deflection point is very clear, occurring at or just above segment 8’s heart rate. Segment 8 had an average heart rate of 159 bpm, which for me is 88% HRmax. As you can see, leveraging our knowledge of physics made analysis of the heart rate data much easier.[9]
While these test results don’t map to performance on the water based on pace since they are done on an ergometer in the comfort of your home or gym, they do map well based on heart rate since the ergometer does a good job mimicking the type of resistance and paddling motions encountered in the canoe. Consequently, you’ll have a hard time using erg pace data to predict race times. But once you know your in-boat pace at HRdefl, you can predict potential race performance fairly well. Plus you’ll know where the “red line” is on your internal tachometer, and can modulate your level of effort accordingly.
You can also conduct a Conconi test on the water if you keep your wits about you re. environmental factors, and if you have a data recording GPS/heart rate monitor. You can program this unit to prompt you to paddle at target paces in successive steps. As you paddle each step it the will record distance traveled, your pace, and your heart rate. Use averaged data, and perform the analysis as outlined above. Note that you should paddle each step on a long deep-water course, with no wind and no current. Otherwise shallow water effects will corrupt your data, as we learned in Part 4: Shallow Water, as will the speed boost from wind or current.
The primary limitation of the Conconi test is that it doesn’t work for every paddler. Some paddlers will perform a Conconi test and the resulting data won’t show an inflection point. While this may reflect an insufficient warm up or step lengths that were too short, some paddlers will have an indistinct deflection point at best. If this happens to you, try the test again in a couple of weeks, paying careful attention to pre-test recovery, proper warm up, and step length. If the resulting test data is still ambiguous, consider using a blood lactate test to determine your anaerobic threshold. Or, use time trial results to estimate HRdefl. Recall that you can paddle at your anaerobic threshold heart rate for about an hour, so find a suitable race or course offering that duration, paddle while holding a consistent heart rate and level of effort, and listen to your body – and write down that heart rate!
APPENDIX: A NOTE ABOUT OXYGEN
Some of you may be thinking, lactate threshold sounds interesting, but isn’t VO2max of greater importance? Important; yes. But more important? For determining race pace, not really.
Aerobic metabolism uses oxygen to fuel the electron transport system. Oxygen binds to an iron- rich protein in the blood called hemoglobin, and is transported from the lungs to the muscles. Oxygen unbinds from the hemoglobin to feed the various muscle oxidative sites, whereupon the hemoglobin binds to carbon dioxide produced by muscle metabolism. This carbon dioxide is carried to the lungs and expelled when you exhale. The volume rate of oxygen you can process metabolically is often written as VO2 (“Volume of O2”), and the maximum volume rate of oxygen that you can process is called VO2max.
VO2max is the most common measure of maximal aerobic capacity. It depends on oxygen diffusion in the lungs, hemoglobin binding efficiency, blood transport, and mitochondrial density and efficiency. It also depends pretty strongly on genetics. Athletes reach VO2 max when their oxygen consumption stops increasing while physical exertion still increases. To reach VO2max the body needs to produce approximately 10 mmol/l of blood lactate, and a respiratory quotient – the ratio of carbon dioxide output to oxygen consumed, denoted as “RQ” – in excess of 1.1.
VO2max can increase with training by only about 20 percent at most. Once a certain aerobic capacity is established, VO2 max will only increase marginally with additional aerobic training. Further, aerobically fit athletes show little fluctuation in VO2max over a season.
Studies have shown that you will see the greatest improvements VO2 max by exercising at intensities corresponding to 90 and 100 percent VO2 max. A 90-100% VO2max effort roughly corresponds to exercise intensities of around 90-100% HRmax. This range corresponds to sprint interval and high-intensity continuous training, an intensity perhaps most appropriate for dragon boat paddlers and sprint canoeists and kayakers. In contract, marathon canoeists need not train at this level of intensity for more than 5% of their total yearly workload.
Since VO2max occurs at approximately 10 mmol/l blood lactate concentration, you will only be able to perform at VO2max intensity for a few minutes at most. For longer races, your actual performance potential depends far more on the submaximal percentage of VO2 max that you can sustain.
Think of VO2max the as an indicator of an athlete’s aerobic potential; anaerobic threshold is an indicator of the athlete’s utilizable aerobic capacity. Anaerobic threshold is more directly affected by the volume and intensity of training than VO2max. For example, a well trained athlete’s oxygen consumption at the anaerobic threshold is almost 90% of VO2max; in untrained individuals the anaerobic threshold occurs closer to 60% of VO2max. Race times correlate very well with blood lactate production. This reinforces the importance of aerobic utilization; you can have all the VO2max you want, but you won’t race fast if you can’t use it.
REFERENCES
Burke, Edmund, Precision Heart Rate Training, Human Kinetics, Champaign, IL 1998.
Janssen, Peter, Lactate Threshold Training, Human Kinetics, Champaign, IL, 2001.
Nolte, Volker, Rowing Faster, Human Kinetics, Champaign, IL, 2005.
Sleamaker, Rob, and Browning, Ray, SERIOUS Training for Endurance Athletes, 2nd Edition, Human Kinetics, Champaign, IL, 1996.
P. Droghetti, C. Borsetto, I. Casoni, M. Cellini, M. Ferrari, A.R. Paolini, P.G. Ziglio, and F. Conconi, “Noninvasive determination of the anaerogic threshold in canoeing, cross-country skiing, cycling, roller and iceskating, rowing, and walking,” European Journal of Applied Physiology (1985) 53:299-303.
© 2018, Shawn Burke. All rights reserved.
v1.2
- If not, you might want to give it a quick read. ↑
- And, possibly, on the water. With a lot of qualifiers and requirements. ↑
- At the same time the brainstem is constricting the flow of blood to the internal organs, enabling more blood to flow to the muscles. ↑
- For those of you who rely on wrist-mounted optical / IR heart rate sensors, note that these can produce inconsistent data depending on how they are worn, and even where on the wrist or forearm they are mounted. Your experience may differ, but consider using a chest strap if you can. ↑
- If your resting heart rate is consistently lower in the evening, however, then by all means measure it then. ↑
- Sports watches that have an “auto lap” feature based on time are ideal since they will break each step into its own lap, and you can extract and average the heart rate for each of these segments separately. ↑
- His proto slide rules were nicknamed “Napier’s bones.” ↑
- For those of you keeping score at home, this property is true irrespective of the base of the logarithm. For the analysis here we’ll use the natural logarithms, with base e. ↑
- I was stunned at how good the data came out. So I repeated the test a week later, and it was just as good as long as I plotted the logarithm of the average heart rate data. ↑