by Shawn Burke, Ph.D.
OVERVIEW
A preliminary study of aerosol transport between the bow and stern seat of a USCA 3×27 “pro boat” tandem (“C-2”) racing canoe is presented. Following a brief overview of aerosols produced by sneezing and coughing, a test protocol is developed for qualitatively assessing aerosol transport between the bow and stern seat positions while the canoe is underway. Test results show significant potential for transport of aerosols between bow and stern seats at less than typical race speeds.
INTRODUCTION
In this installment of the Science of Paddling series we take a diversion from the usual “fun with physics” to consider the implications of paddling in the midst of a viral epidemic. This was motivated by a recent article by B. Blocken et al., “Towards aerodynamically equivalent COVID-19 1.5 m social distancing for walking and running.” Their research used a CFD (Computational Fluid Dynamics) simulation to model whether trailing walkers and runners could encounter droplets emitted by leading walkers or runners in various formations: side-by-side, staggered, and in-line. In their simulation the ambient wind was zero. Consequently, the simulated walkers / runners would be exposed to droplets by walking / running into the aerosol “cloud” emitted by the person in front of them. They noted:
“The results indicate that the largest exposure of the trailing person to droplets of the leading person for walking and running is obtained when this trailing person is in line behind the leading person, i.e. positioned in the slipstream.” [B. Blocken et al., Abstract]
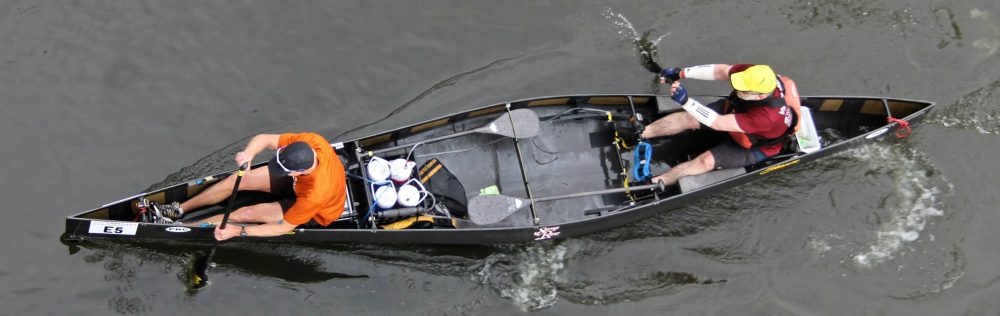
As a stern paddler this study gave me pause. We paddle our tandem canoes and kayaks, C-4s, OC-6s, dragon boats, etc. “in line behind the leading person.” What might – emphasis on might – the implications be for paddlers if a symptomatic or asymptomatic virus carrier in the bow coughed or sneezed an aerosol cloud? At race speeds are these aerosols transported front-to-back to the stern paddler?
In what follows we provide a brief overview of what aerosols are, summarizing models for their falling and transport. The detailed fluid mechanics of aerosols are rather complex. So rather than try to develop a CFD model for paddlers, a “citizen scientist” experiment is proposed using box fans, a USCA 3×27 pro boat, and a commonly-available aerosol to study aerosol propagation from bow to stern. The experimental setup is laid out, and the results of testing presented.
Lastly, before we proceed, you might want to review “Part 13: Where’s the Science.” It is important to understand the role of underlying assumptions and their attendant limitations when reading this article; we all need to “stay in our lane.” This article also makes no claims about viral transmission; this is only a plausibility study for aerosol transport.
AEROSOLS
When a person coughs or sneezes – or even when they sing or talk – they are emitting aerosols. Aerosols are merely gaseous suspensions of fine solid particles or liquid droplets. Examples are shown in Fig. 1.
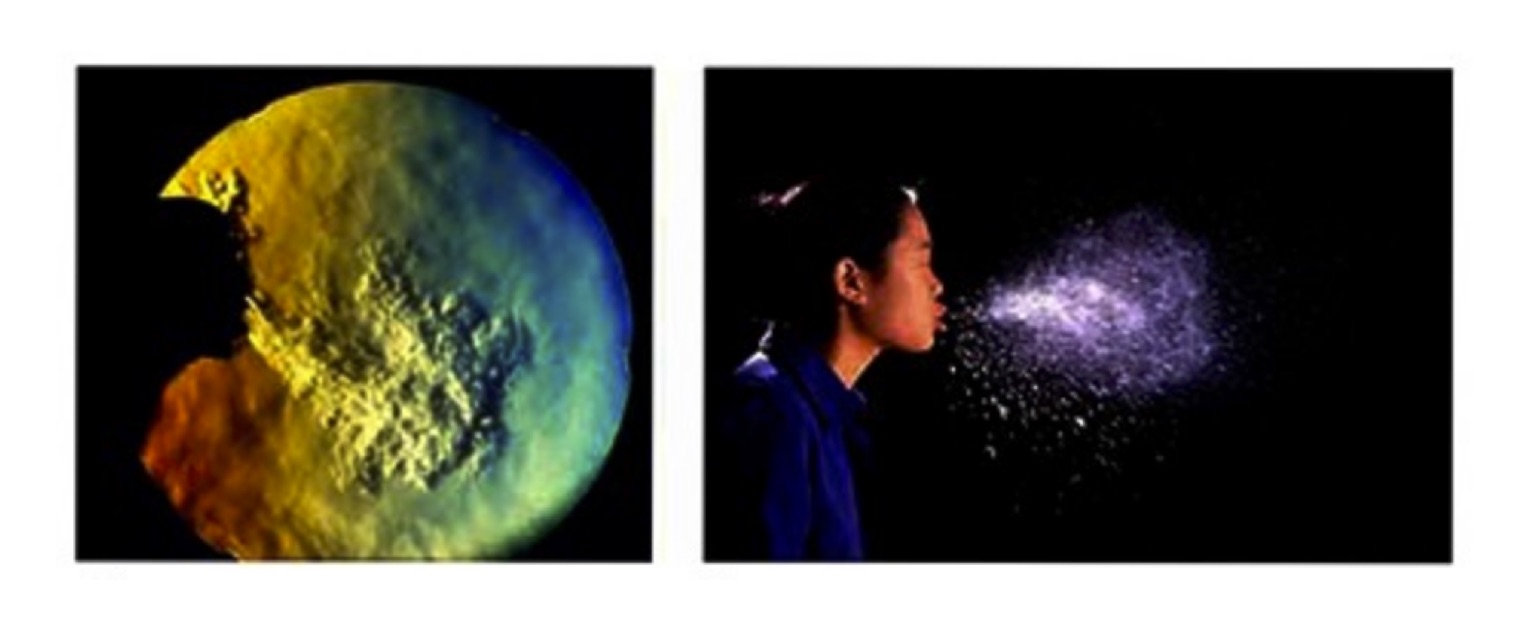
Figure 1: Schlieren image (light refraction image) and flash photograph of the aerosol clouds produced by a cough (L) and a sneeze (R). [from J. Atkinson et al., editors, Natural Ventilation for Infection Control in Health-Care Settings, Annex C: “Respiratory Droplets”]
Aerosol droplets produced by humans include mucous and saliva, shed skin cells, and may contain bacteria, fungi, and viruses. A “droplet” is generally considered to have a diameter greater than 5 μm. A “droplet nuclei” is a droplet with diameter less than this. Sneezing may produce as many as 40,000 droplets and droplet nuclei between 0.5–12 μm in diameter, while coughing may produce up to 3,000 droplet nuclei, as well as thousands of droplets ranging in size from 10 to 100 μm [J. Atkinson et al., editors, Natural Ventilation for Infection Control in Health-Care Settings, Annex C: “Respiratory Droplets”].
Droplet nuclei can remain suspended in air for significant periods of time, allowing them to be transmitted over distances greater than 1 m even in still air. Human-produced aerosols contain a range of droplet sizes. In still air – because of gravity, diffusion, and other effects – droplets with a diameter of 100 μm will fall 2 m in about 6 seconds, those with a diameter of 10 μm will fall 2 m in about 10 minutes, while those with a diameter of 1 μm will fall 2 m in about 16.6 hours [W.F. Wells, “On Air-borne Infection. Study II. Droplets and Droplet Nuclei.”]. The aerosol “cloud” from a cough or sneeze will contain a distribution of droplets covering these size ranges, with a corresponding range of fall times.
Now consider the two side views of a C-2 shown in Fig. 2. For this scenario the local wind is still, and we adopt a hull frame of reference. In the top image at t = 0 an aerosol cloud is created at approximately head height over the bow seat. At some later time set by the hull’s forward speed V this aerosol cloud, fixed in an Earth-centric reference frame, is now over the stern seat as shown in the lower image. D is the spacing between bow and stern seats, used to compute the transit time as a function of V. Since the aerosol from a cough or sneeze comprises a wide variety of droplet diameters the cloud is shown to have dispersed a bit – at least in the vertical direction.
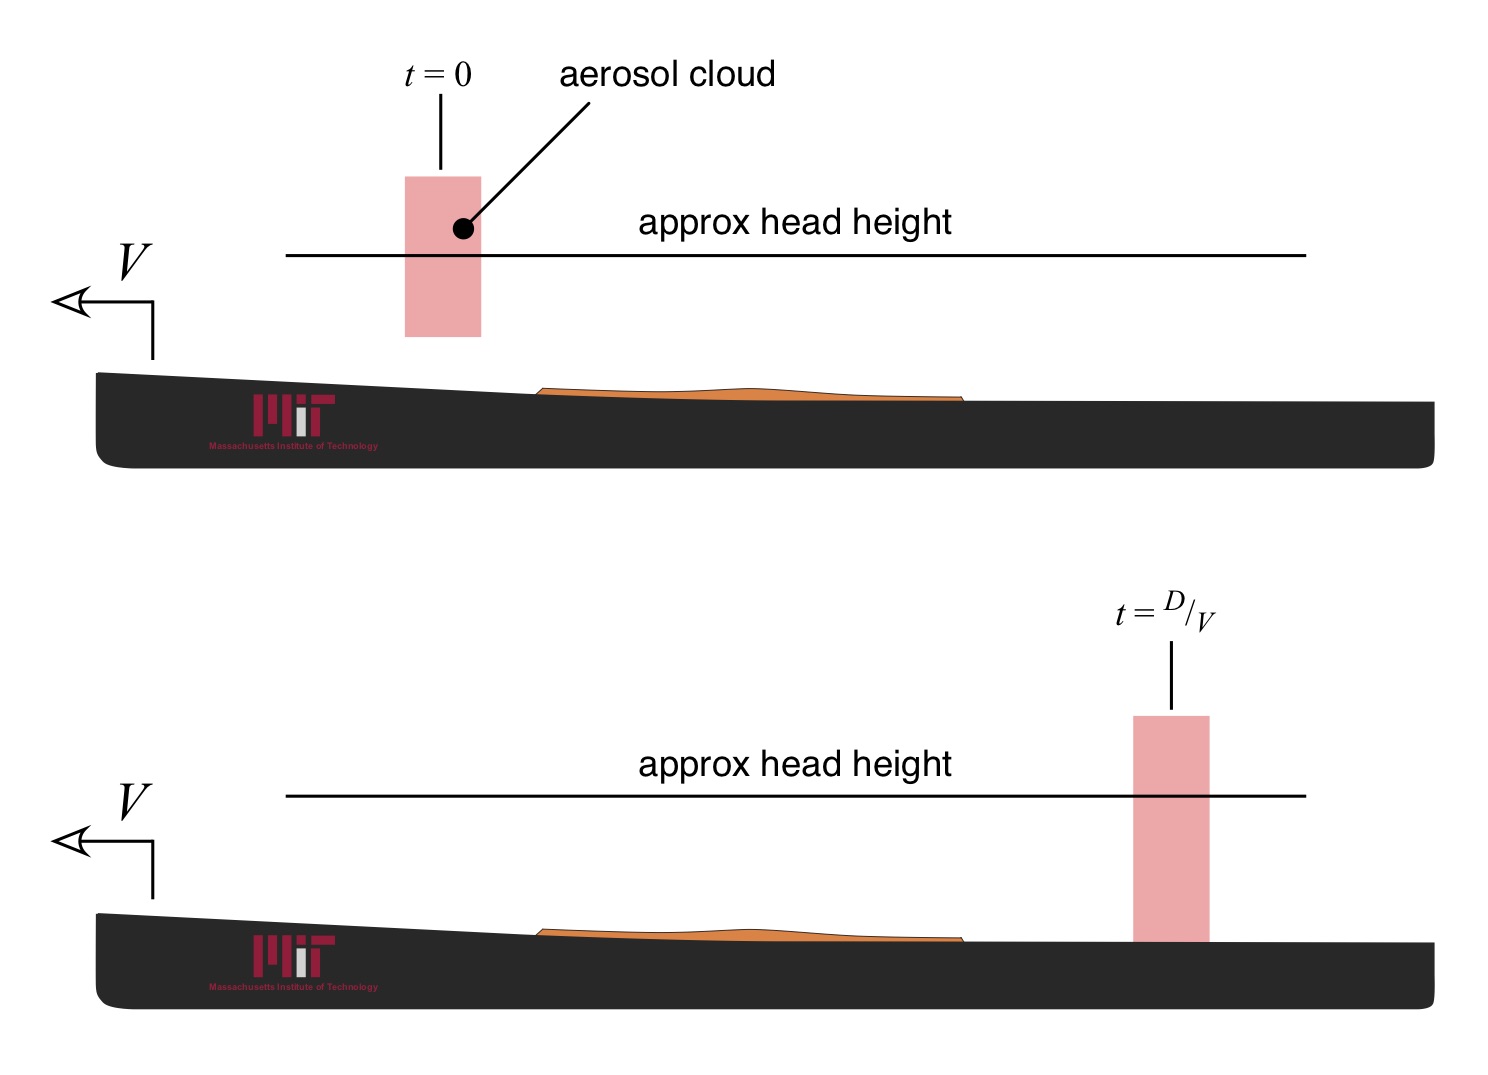
Figure 2: Aerosol cloud transport hypothesis.
The transit time for the aerosol cloud between bow and stern seat is listed in Table 1 for various hull speeds V for a seat spacing D of 9.75’.
| Speed (mph) | Transit Time (sec) |
| 2 | 3.33 |
| 3.9 | 1.7 |
| 5.8 | 1.15 |
| 6 | 1.11 |
| 6.5 | 1.02 |
| 7 | 0.95 |
Table 1: Transit times.
Given these transit times it is apparent from the droplet fall times listed above that many droplets and most droplet nuclei will still be airborne, and will not have fallen onto the deck cover or the bottom of the hull by the time the stern paddler enters the aerosol cloud. Smaller droplets will still be suspended at around head height; larger droplets will encounter clothing and, depending on the hull speed, the hull itself.
This high-level analysis suggests that aerosols like those produced by coughs and sneezes can indeed be transported from a bow paddler to a stern paddler. But I’d also like some data. Can we produce aerosols and transport them “in the field,” or on the water, to verify both simulation and analysis? Well, sure; otherwise, why ask the question (and continue writing)? To do so we’ll rely on a physics principle attributed to Galileo Galilei. And spray paint.
TESTING 1-2-3
When a hull moves through water the paddlers experience airflow past them, even when the wind is still. In the reference frame of the paddlers the hull appears stationary, while air appears to flow past, as represented in Fig. 2. In order to study aerosol transport “in the field” one could install an aerosol generator of some sort in the bow of a C-2, paddle the hull, and collect the aerosol droplets on a target screen in the stern. It’s just that the logistics get a complex. What will generate the aerosol, and trigger it? Does the stern paddler want to get sprayed while paddling?
Instead, we can take advantage of a Galilean transformation to construct our experiment[1]. A Galilean transformation is merely a “swap” between two frames of reference which differ by a constant relative speed. Consider the two side views of a C-2 as shown in Fig. 3. In the top image the hull is moving with constant speed V in an Earth-centered frame of reference. The ambient wind speed is zero. To a paddler on board it appears that the hull is stationary in their “paddler-centric” frame of reference, and the wind is moving past at speed V. So here, an obvious Galilean transformation is to fix the hull in place with respect to the Earth, and move air past it at speed V. This is suggested in Fig. 3’s lower image. This insight is the basis upon which all wind tunnels operate: rather than fly the plane through the air to test its performance, one instead builds a model of the plane and moves air past the model.
Figure 3: Galilean transformation for a hull.
The next item on our experimental checklist is aerosol generation. Perhaps I could have found a person with a cold and had them sneeze in the wind, then catch (some of) the resulting aerosol cloud 9.75’ downstream. Or… not. Or I could use a sprayed aerosol, such as microspheres or other particles with controlled, consistent diameters. Given TSOP’s (nonexistent) lab budget, I instead went to the hardware store and bought a can of spray paint.
Automotive base coat spray paint – the closest analog to the general-purpose spray paint I used – has a mean droplet diameter ranging from 20 – 40 um, with a fairly large (3 sigma) diameter standard deviation [L.M. Brosseau et al., “Particle Size Distribution of Automobile Paint Sprays”]. This size range overlaps with the cough / sneeze aerosol droplet size range delineated above. So I substituted spray paint for sneezes, and it was time to assemble the experiment.
Since TSOP does not have access to an atmospheric effects wind tunnel[2], I resorted to the best available wind source I could find: a pair of box fans. The test configuration is shown in Fig. 4. Two 20” box fans were placed atop 2×8 planks set on top of sawhorses. The central hub of the fans sat at approximately nose height for a 5’11” paddler having a 32” inseam. A folding sign straddled the C-2’s stern, and held my Dad’s old construction helmet at approximately head height for that same paddler, centered over the stern seat. 8.5” x 11” paper “targets” were hung beneath the helmet visor as shown in Fig. 5. The paper was attached to a curved cardboard backer with the long dimension oriented horizontally. One target was white printer paper with a 1” x 1” grid printed over it, while the other was black construction paper. Since the spray paint was silver the black construction paper made it easier to see any collected aerosol at the stern position.
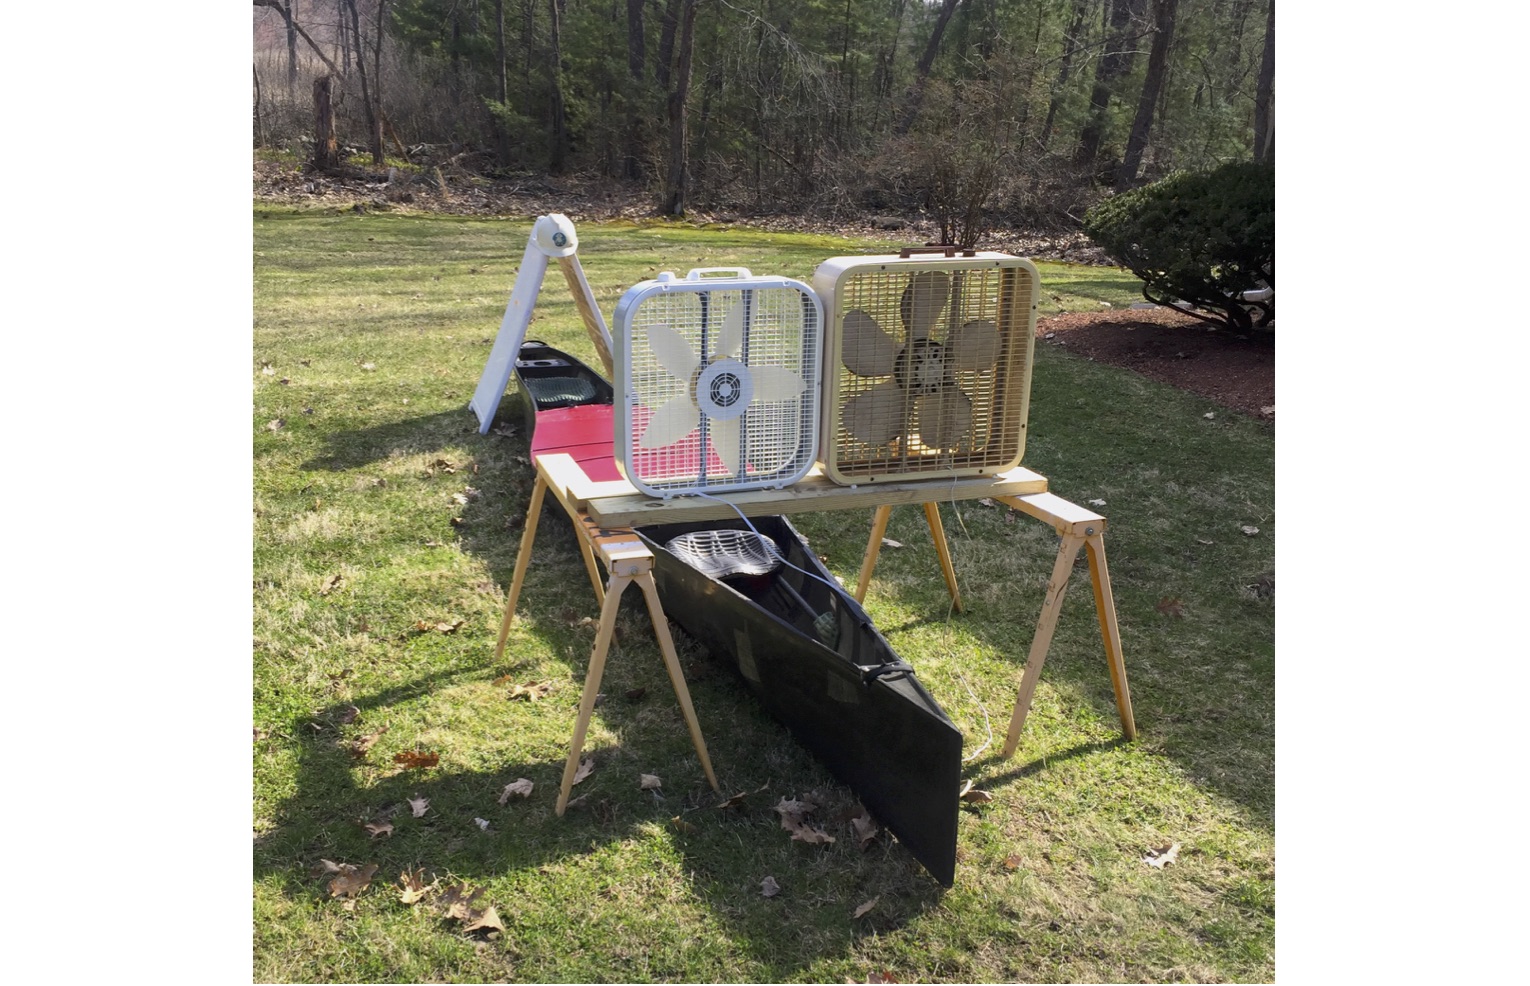
Figure 4: Test configuration.
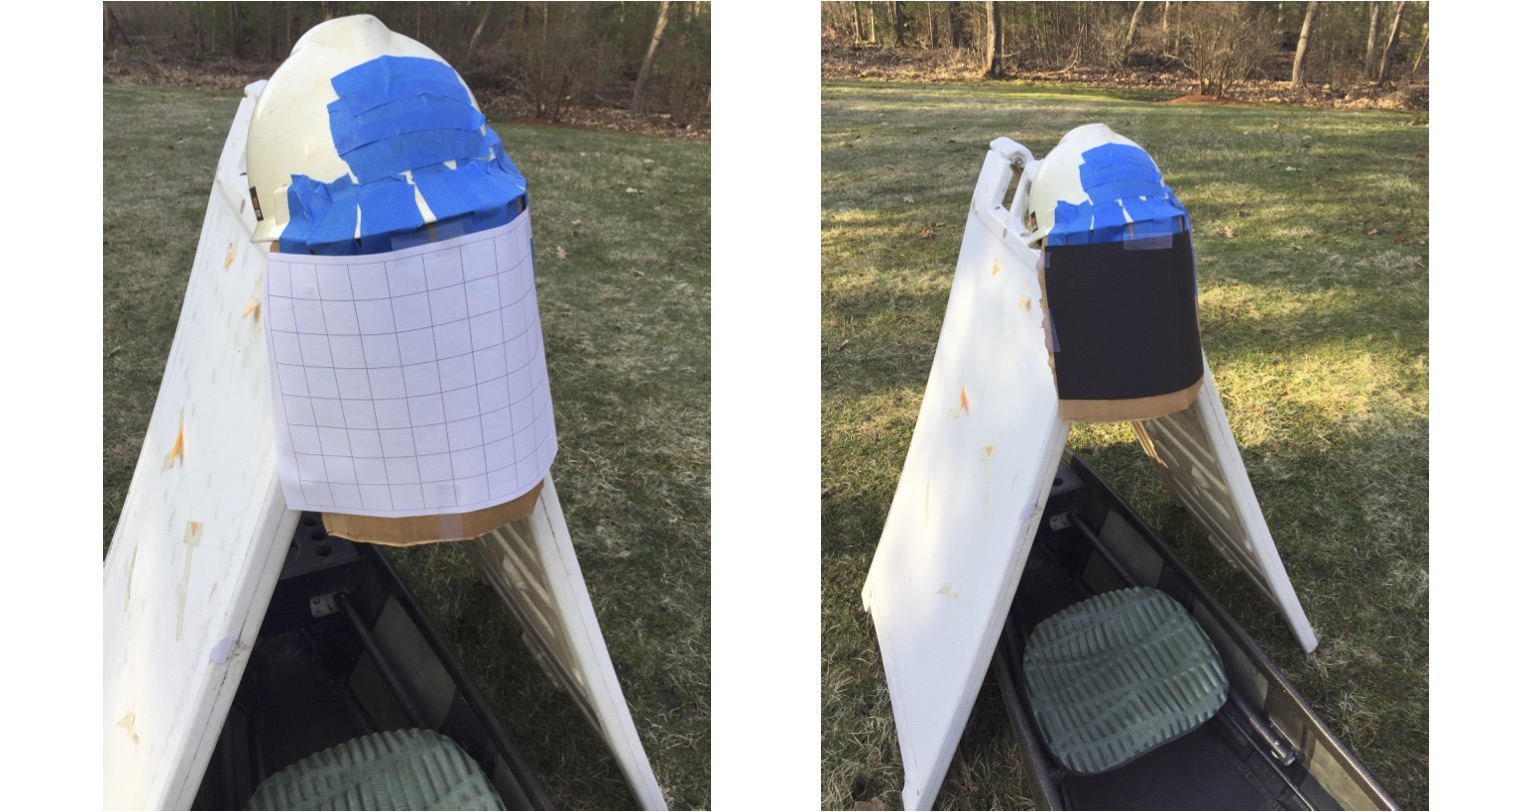
Figure 5: Test targets.
A plan view of the experimental setup is presented in Fig. 6. The downstream edge of the box fans was placed approximately 2’ 8” from the center of the bow seat. At this distance the airflow was a bit more uniform. In order to get greater flow uniformity one would ideally introduce flow straighteners, e.g. a collection of tubes packed tightly into a grid downstream of the fans. And even better, one would have a proper wind tunnel with the fans downstream of the hull, pulling the flow over it. But we’ll have to wait for the next influx of funding before we get to that.
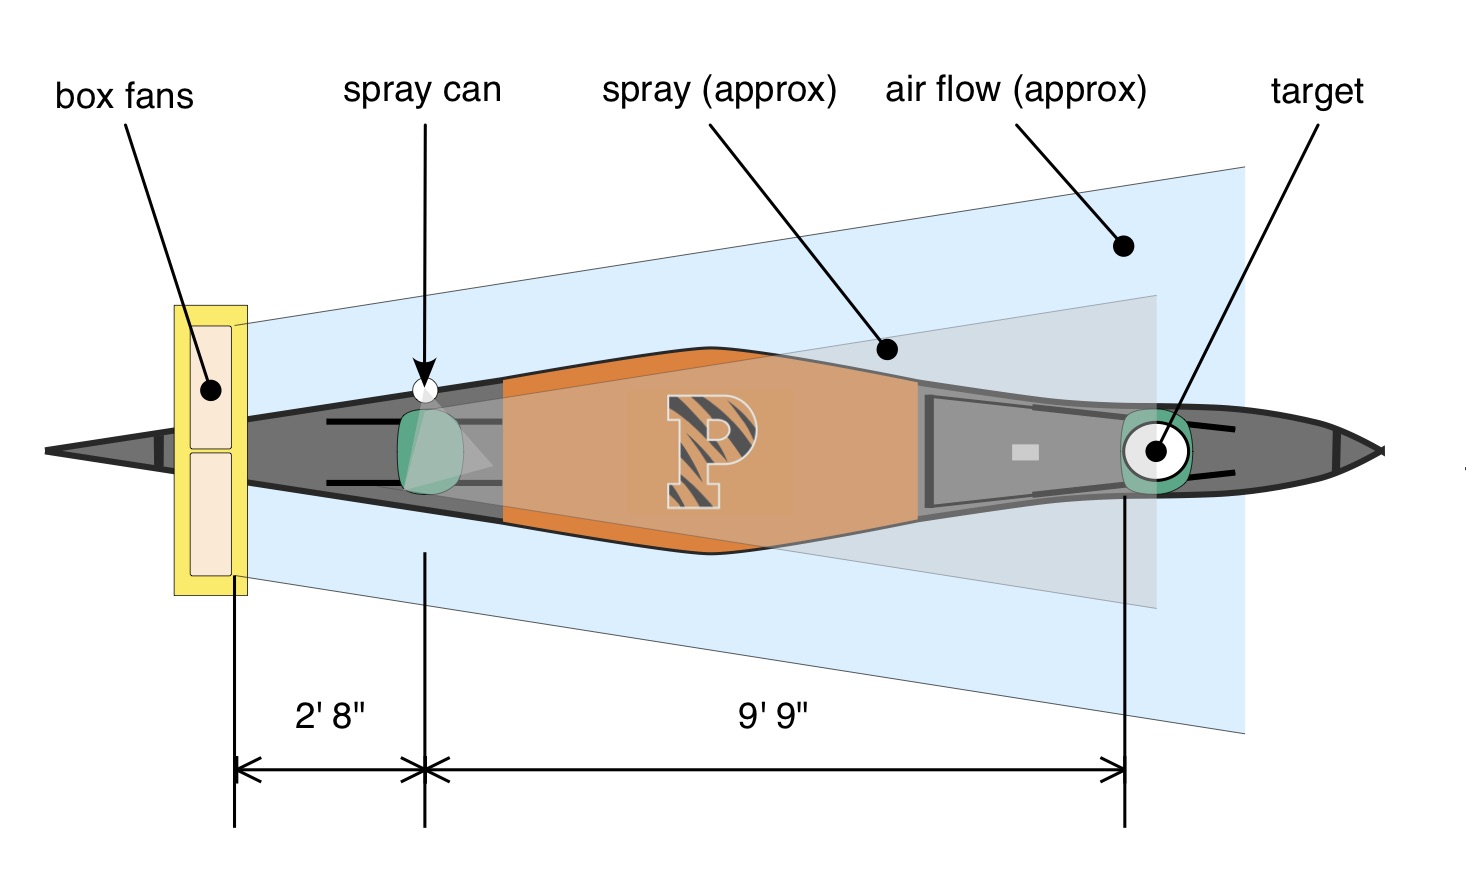
Figure 6: Test setup plan view with flow/aerosol transport concept.
I splurged and bought a digital anemometer (Fig. 7) to measure flow speed spanwise across the center of the bow seat (Fig. 8), and spanwise in front of the stern target. Testing commenced at 7:15 am on Sunday April 12, 2020. The ambient temperature was 28F, and the anemometer measured 0 mph ambient wind speed. The fans were turned on, and average air speed across the spanwise dimensions of the fans at the bow seat location was measured to be 5.8 mph. This is in the range of speeds where one is briskly paddling a pro boat, but not yet full racing speed. In front of the stern target the average air speed was 2 mph. This reduction in air speed compared to the 5.8 mph upstream is attributed to the expansion of flow in a “fan” (no pun intended) downstream of the box fans, as suggested in Fig. 6. This reduction in speed vs. distance means that the test setup may under-represents the potential for droplet transport at racing or even training speeds; the average (along track) air flow speed between the bow and stern seat is 3.9 mph.
Figure 7: Anemometer.
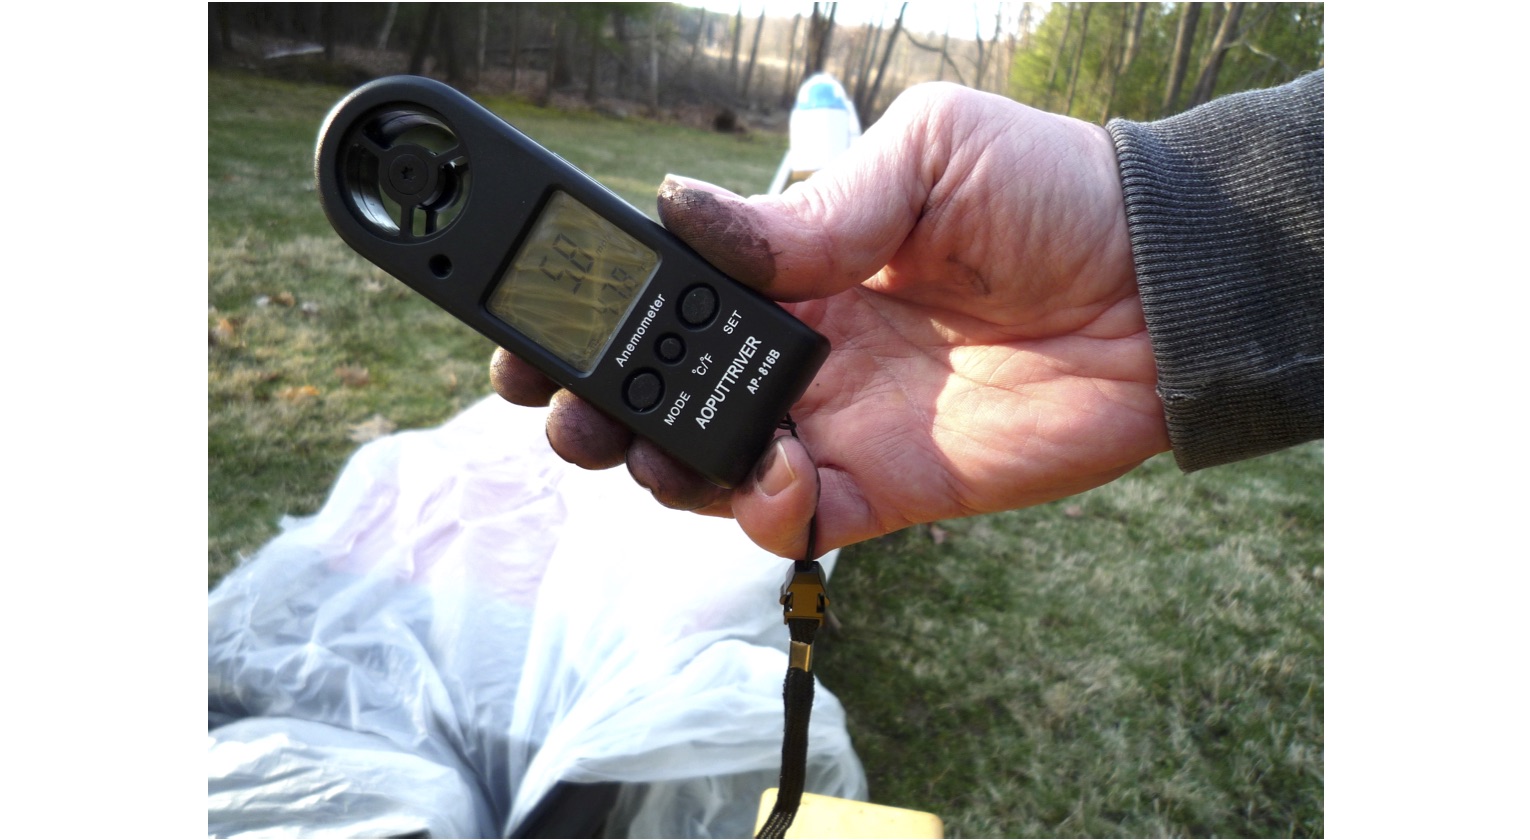
Figure 8: Measuring a flow speed by bow seat.
Once the flow stabilized I probed the flow field with some of the paint spray as shown in Fig. 9. This configuration showed that I could inject the aerosol perpendicular to the air flow direction and have it quickly turn toward the target location. This phenomena is analogous to a bow paddler turning to one side and coughing or sneezing. For testing I pressed the spray nozzle for 5 seconds and let the spray be carried by the air flow toward the target. This spray duration was chosen because the goal was to assess whether aerosol transport could occur at all, rather than to measure what fraction of an ejected aerosol cloud actually impinges on a stern target. This approximation is consistent with the limitations of the experimental setup listed above. Tests were conducted for two white targets, and for one black target, using silver paint.
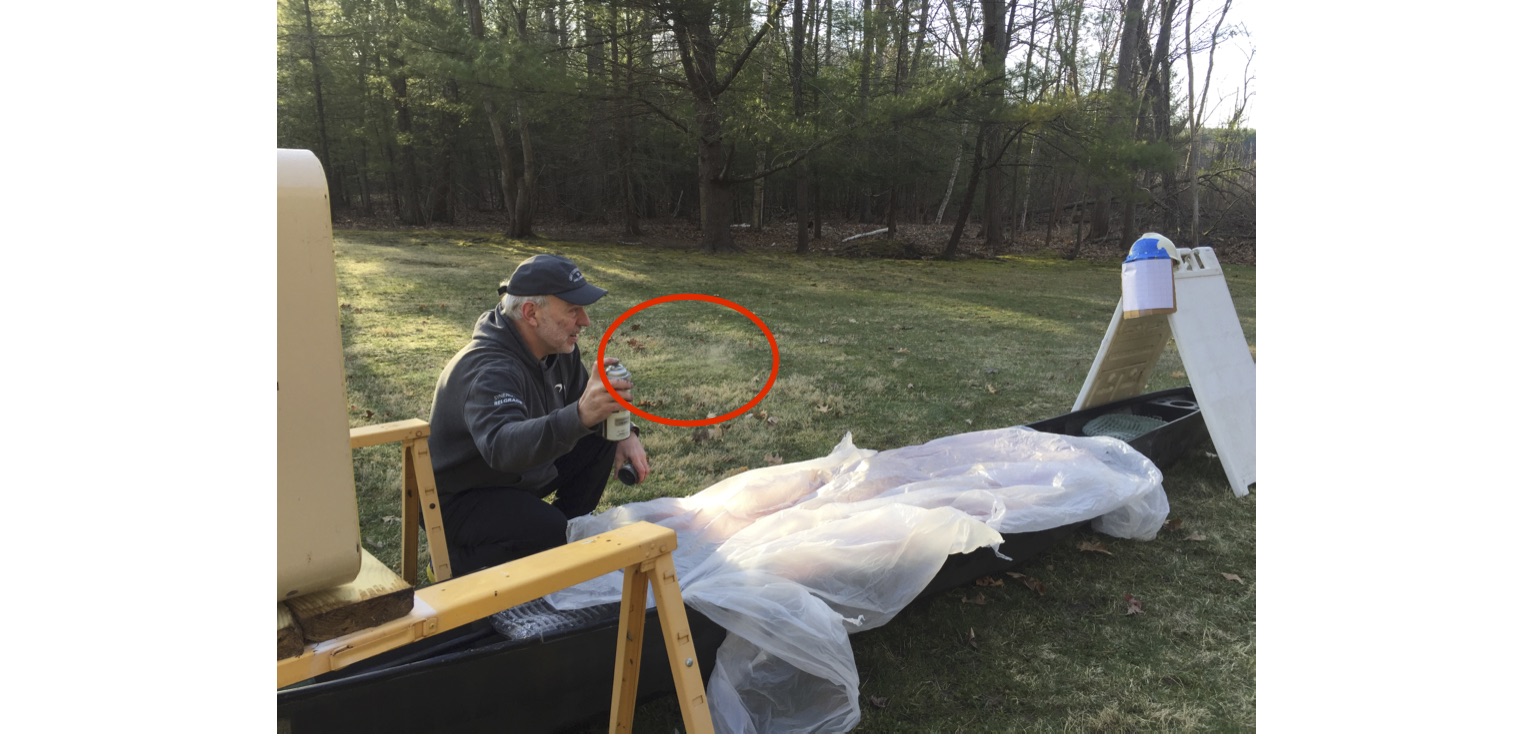
Figure 9: Trial run – aerosol cloud highlighted.
RESULTS
Fig. 10 is a photo of a section of the black test target from one of these tests. A ruler is included to provide scale. While this would be a heck of a way to paint a car, it does show that droplets are readily transported from an aerosol cloud created at the bow seat to the stern seat. Close-up images of one of the white targets and the black target are shown in Fig. 11. Contrast in the white target image was adjusted so that the spots of silver paint were easier to see; this reinforces the utility of the black target.

Figure 10: Black target, wide view.
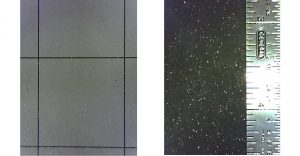
Figure 11: White (L) and Black (R) targets, Dino-Lite microscope images.
As seen in Figs. 10 and 11 various sizes of droplets were transported bow-to-stern and attached to the two targets. The actual aerosol droplet diameters aren’t known, but since the paint volume of the “spherical” droplets spread out upon striking the targets, transforming from 3D droplets to thin 2D disks with greater diameter, one can infer that the droplets reaching the targets were a fraction of a millimeter in diameter consistent with the expected diameter range for sprayed paint. To the extent that these are reasonable analogs of human-produced aerosols, one can infer that aerosols produced by coughs and sneezes may be transported from bow to stern when a canoe is underway even at less than race speeds.
DISCUSSION
In this installment of the Science of Paddling series we considered a preliminary study of aerosol transport between the bow and stern seat of a USCA 3×27 “pro boat” tandem racing canoe. Following a brief overview of aerosols produced by sneezing and coughing a test protocol was developed for qualitatively assessing the transport of similarly-sized aerosols from the bow seat to the stern seat positions while the hull is underway. The test results show significant potential for transport of aerosols between bow and stern seats at even less than typical race and training speeds.
I must emphasize that this is a preliminary study; an example of “citizen science” with the goal of determining how plausible aerosol transport is between two paddlers in a canoe. In order to answer this question definitively one should employ an appropriately sized wind tunnel, bow and stern dummies to provide the best aerodynamic fidelity, use aerosols of known diameters and relevant properties with calibrated collection means, etc. Virologists would then prescribe injected aerosol volume, describe viral load, and the like; these lie well beyond the scope of this study. The goal of the present study was to see if further research is warranted, and my conclusion is that it is.
Even with these caveats the tests indicate that aerosols can be transported between tandem canoe paddlers while underway. I’m neither a virologist nor an epidemiologist, but I find the results compelling enough that – for me – I’ll be paddling C-1 for a while.
One might ask, “What about cross winds? Tail winds? Head winds? C-4s and dragon boats? Adjacent boats and pack riding?” These are all good questions; questions worth asking. The Wells droplet falling time data suggest the results may be similar as long as at least one paddler is downwind (via wind or slipstream, or the vector sum of both). But these questions merit experiments or high-fidelity CFD simulations to bring them to ground. There’s always more work to do.
Be well, everyone.
(c) Copyright 2020, Shawn Burke. All rights reserved. See Terms of Use for more info.
REFERENCES
B. Blocken, F. Malizia, T. van Druenen, T. Marchal, “Towards aerodynamically equivalent COVID-19 1.5 m social distancing for walking and running,” preprint (2020).
W.F. Wells, “On Air-borne Infection. Study II. Droplets and Droplet Nuclei.” American Journal of Hygiene, Vol. 20, pp. 611-618 (1934).
J. Atkinson, Y. Chartier, CL Pessoa-Silva et al., editors, Natural Ventilation for Infection Control in Health-Care Settings, World Health Organization (2009), Annex C: Respiratory Droplets.
J. Wei, Y. Li, “Human Cough as a Two-Stage Jet and Its Role in Particle Transport,” PLOS ONE | DOI:10.1371/journal.pone.0169235 (January 3, 2017).
L.M. Brosseau, C.P. Fang, C. Snyder, B.S. Cohen, “Particle Size Distribution of Automobile Paint Sprays,” Applied Occupational and Environmental Hygiene, Vol. 7(9), pp. 607-612 (1992).
P. Baron, “Generation and Behavior of Airborne Particles (Aerosols),” presentation of the Division of Applied Technology, National Institute for Occupational Safety and Health and Centers for Disease Control.
“Tables for Use in Aerosol Physics,” MesaLabs publication, downloaded from www.gsiusa.com.