by Shawn Burke, Ph.D.
Some of us augment our race season prep with strength training; many of us do not. I’ve felt that strength training has helped me with starts and jumps. But that assessment is purely qualitative; my stroke feels “stronger” if I’ve been lifting conscientiously, but what does “stronger” mean? I know lots of excellent paddlers who routinely crush me out on the course once we’re past the start. How much has strength training benefited me downstream? Is the time I spend on strength training providing enough benefit to keep doing it? Equally as important, am I doing it “right”? And for paddlers, what is “right”?
In this installment of The Science of Paddling I’ll make the case for an approach to strength training that aligns with the physics of paddling. This is a work in progress. I don’t know yet whether or not it is “right.” But the underlying philosophy is grounded in both physics and exercise physiology, and (so far) is borne out by my own experiments. In order to make the case we’ll first review more conventional ideas of the functional benefits of strength training. Then, we’ll add a pinch of physics and see what happens.
ON “CLASSIC” STRENGTH TRAINING
My introduction to strength training came in college. I knew lots of jocks, mostly football players. I would diligently follow them to the gym and muck about with free weights and machines. The gospel was “three sets of ten reps[1]” for each exercise. I certainly gained muscle doing this, and got my scrawny upper body more in balance with my lower body. And that was about it.
When I decided to get serious with off-season training about a decade ago I researched strength training for paddlers. Mostly what I found were prescriptions for specific exercises. Then, in Tudor Bompa’s Periodization, as well as his Periodization Training for Sport, I found detail; lots of detail. Bompa laid out the benefits of lifting weights at specific fractions of one’s single repetition maximum[2] (“1RM”) for particular exercises in light of what function(s) one wished to train. An example of this breakdown appears in Fig. 1. Note that we’re not yet talking about any particular exercise; that will come later. For the moment let’s consider any exercise, generically.
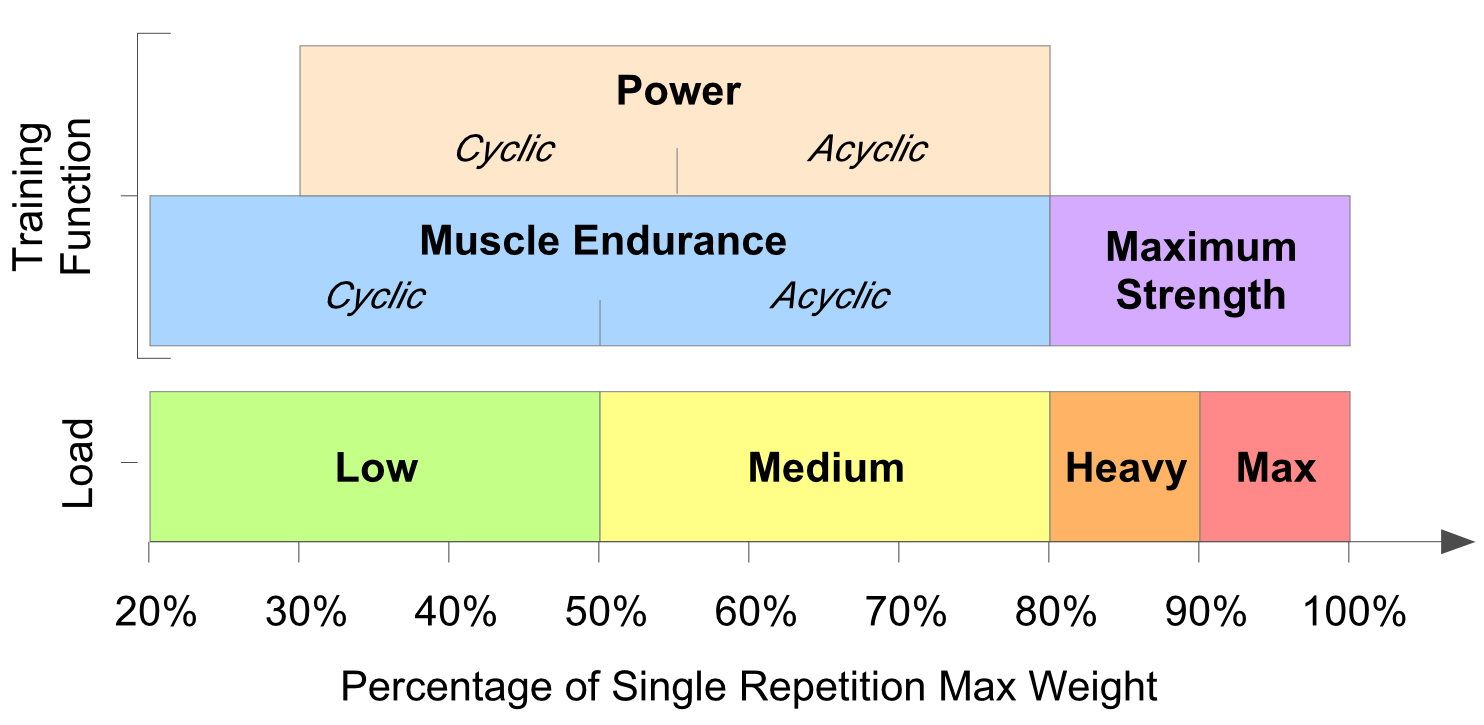
Fig. 1: Functional benefits of weight training vs. percentage of 1RM (after Bompa).
Through this figure Bompa conveyed his (and others’) notion of the functional benefits from performing an exercise at some fraction of that exercise’s 1RM. Lifting a load from 80-100% of 1RM benefited one’s maximum strength for that exercise. From 30% to 80% of 1RM benefited “Power,” which he linked to various forms of muscle endurance: acyclic movements (single or infrequent, like jumping or lunging during a game of basketball) and cyclic movements (frequent, regular movements… like paddling). Further, from Bompa I first learned about the relationship between % of 1RM and how many repetitions one could do in a single set of a particular exercise before one couldn’t do another, aka “reps to failure.” This is illustrated in Fig. 2 below.
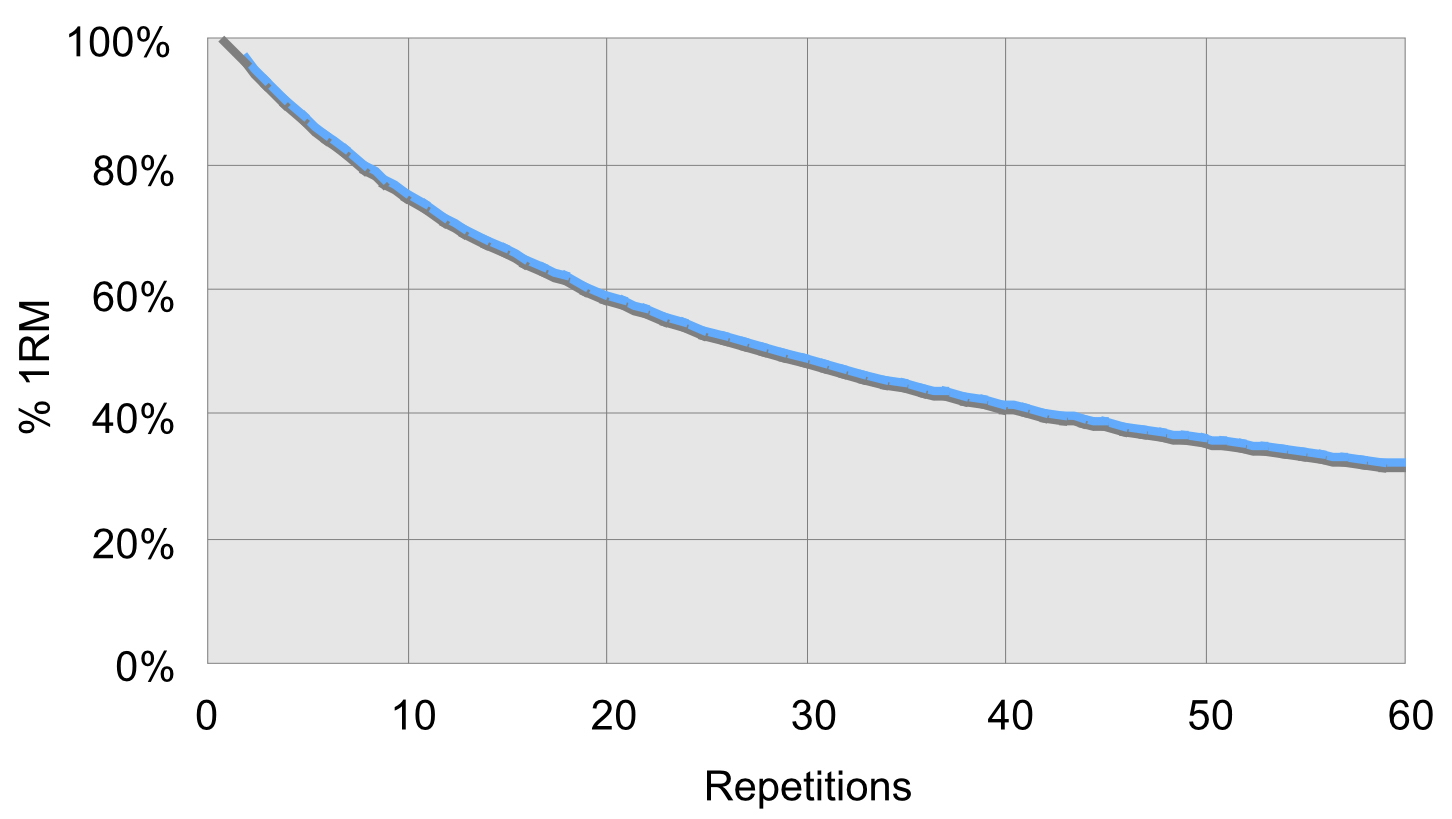
Fig. 2: Repetitions to failure for loads that are a percentage of 1RM.
In this Figure we see that you can lift 100% of your single repetition maximum, well, once. You can lift 90% of your 1RM four times; 72% of your 1RM ten times; and so forth. And when I say “four times,” that means you can’t perform that same exercise a fifth time within the same set. Ditto for ten repetitions at 72%; if you can do an eleventh repetition you’re lifting less than 72% of your 1RM.
I found that the relationship between the number of repetitions I did in a single set to failure vs. weight lifted tracked this curve remarkably well down to about 50% of 1RM. Below that, not so much. I did lifts at 80-90% to increase maximum strength; 70-80% for “Power,” and so forth. I got stronger, and a little bigger. But aside from feeling “stronger” it was unclear how this work benefited my performance on the water.
After doing this for 4 years whatever nebulous benefits I reaped from horsing around all that weight plateaued. My muscles didn’t feel as tired late in races as they once did (though the rest of me did!) I was looking for something different. My friend and fellow paddler Tom Walton pulled me aside after our first General Clinton Canoe Regatta and said, “I’ve got the workout for you.” This consisted of four (mostly) paddling-specific exercises, done using body weight only, performed as a circuit[3], running through the circuit 3-5 times. The exercises? Pullups, ab wheel rollouts, inverted rows[4], and pushups. Doing this workout 3-5 days per week helped me, and the workout only took 20-25 minutes to boot. I think a good deal of the benefit came from how these exercises emphasized core engagement while doing functional exercises.[5]
I thought that was it. And yet something was still niggling at me. I’m an engineer; I’m driven to ask “Why?” I understood that the exercises were paddling specific. But aside from feeling a further benefit on the water, could I get even more bang for the buck if I did these exercises… differently?
TIME FOR SOME SCIENCE
For those of you who suffered through this long preamble, let’s get down with our nerdy selves. I’ve embarked on an experiment this off-season inspired by two things. First, in putting together the Science of Paddling website I re-read all of my past articles.[6] In the first installment we learned that the steady-state cruising speed V of a canoe or kayak is proportional to the cube root of the average power P provided by the paddlers:
![V\propto \sqrt[3]{P}\times {{L}^{\frac{2}{3}}}](https://s0.wp.com/latex.php?latex=V%5Cpropto+%5Csqrt%5B3%5D%7BP%7D%5Ctimes+%7B%7BL%7D%5E%7B%5Cfrac%7B2%7D%7B3%7D%7D%7D&bg=ffffff&fg=000&s=0&c=20201002)
Note that this equation does not show that speed is proportional to strength, which would be represented by just the force one applies to the water through the paddle. Since speed is not proportional to strength in itself, this suggests that merely getting stronger, and thus able to apply a lot of force to the water through a paddle, is not sufficient to move a hull fast. This argues against doing traditional strength training for paddling (unless, of course, one needs to establish a base of strength on which to do more targeted training – then it makes sense). Instead, we see that speed is proportional to power. Well, what is power?
Power P is the rate of doing work, or the amount of energy transferred per unit time. Mathematically, power is equal to the product of the applied force F times the velocity v at which this force is applied[7]:

Since velocity v is distance d divided by time t, we see that power can also be expressed as

Now force times the distance over which the force is applied is defined as work. This reinforces the definition of power as work per unit time.[8]
In plain terms “large” power is the application of a force quickly, and in the context of paddling doing this over and over (and over and over…). So which do you train: for more force, or for more velocity? What if you could actually train power directly rather than deconstructing it into its component parts?
This is where the “second thing” comes in. I was reading one of my favorite tech blogs (Ars Technica – highly recommended) when I saw a review for a new exercise gizmo that measures the velocity[9] of your movements during exercise. And, since for a particular exercise you know the weight you’re moving, you’ll know the power exerted during that exercise. This gizmo is the “Beast” sensor, made by Beast Technologies S.r.l. in Italy[10]. The product comprises a small Bluetooth 4.1-connected sensor that can be placed atop a weight stack, inserted in a wrist band (for bar-based lifts), or worn on a body mount (for pushups, pullups, inverted rows and the like) to capture movement and thus velocity. The photo below shows the sensor atop the stack of a multi-station cable weight machine.
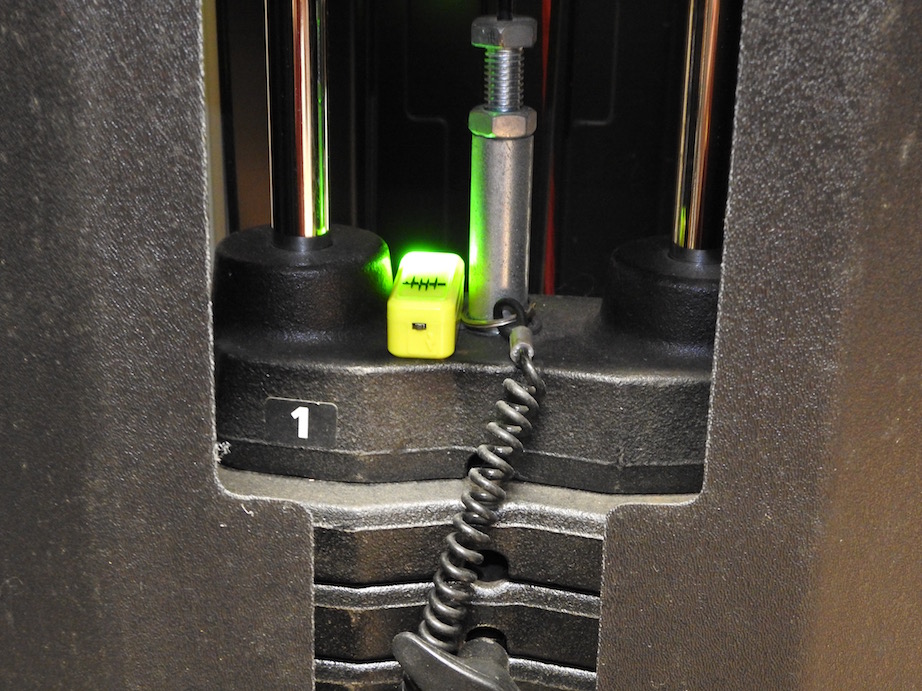
Fig. 3: Beast sensor atop weight stack.
The Beast sensor sends average velocity data to a connected smartphone app. This app lets you select an exercise, enter the weight you’ll be lifting, and then presents a “Start” button you press when you’re ready to perform the exercise. For each and every lift you can have it report either the velocity of your lift (in m/s) or the power of your lift (in Watts). And you can watch it on the screen during each rep along with a bar graph of each rep’s velocity. Here’s an example:
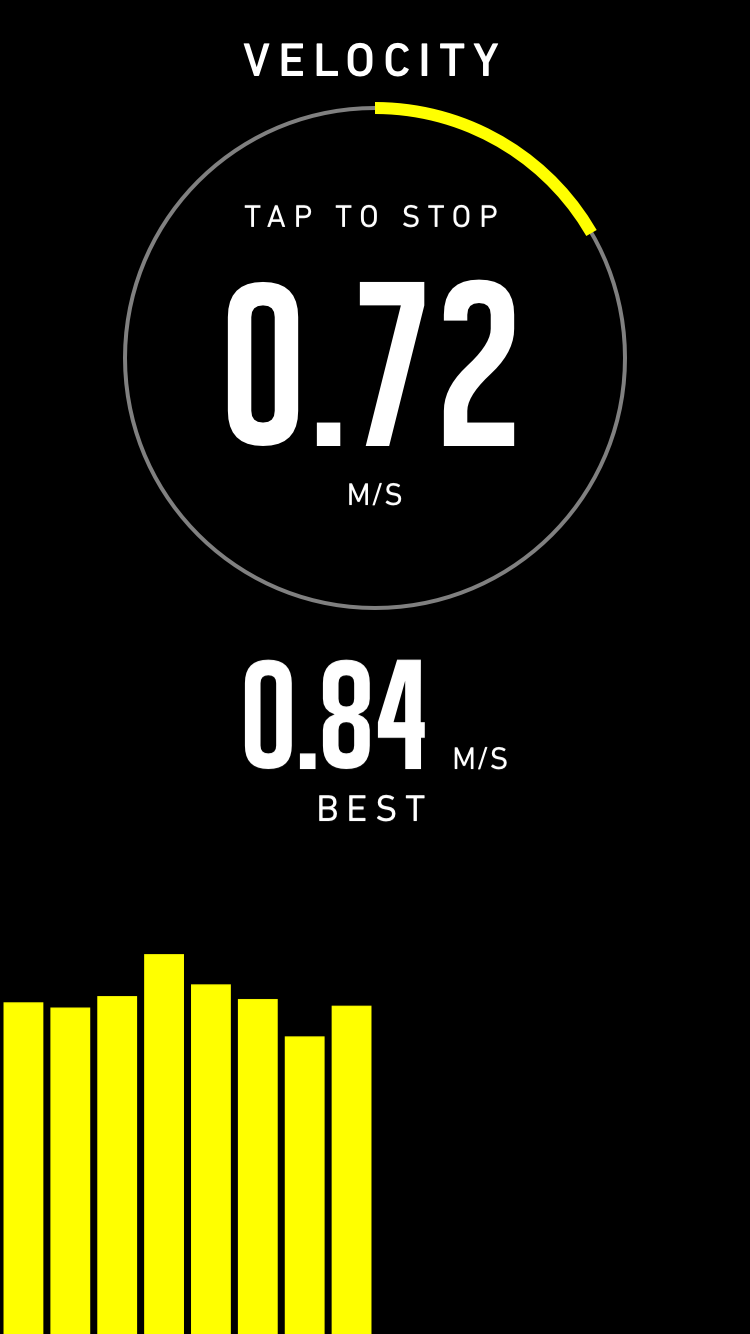
Fig. 4: Beast sensor app display.
OK; great. There’s a gizmo. Engineers like gizmos. Now what?
VELOCITY BASED TRAINING
In researching the Beast sensor I learned about a branch of strength training called “Velocity Based Training” or “VBT.” VBT’s thesis is that there are certain training ranges based on moving weights at velocities that correspond to specific functional benefits. This sounds a bit like Bompa’s training ranges based on percentages of single repetition maximum lifts, and in a way it is similar. But VBT differs in a key way.
In “classic” strength training one works out, determines their 1RM, and lifts at some fraction of 1RM until it improves, or they get bigger, or achieve some other goal. And so on. But – and here’s the big caveat – on any given day an athlete doing strength training can have a different 1RM. Hard training over previous days, irregular sleep patterns, stress and the like can actually lower 1RM; 1RM is not an inviolate quantity. This means that on a given day prescribing 3 sets of 10 reps at 70% max may actually result in the athlete lifting 80% of their 1RM, and the desired training effect will not be achieved. Do this enough and injury or overtraining can follow. Or prescribing lifts at 70% of max may actually correspond to 60% of 1RM on a given day, and again the desired training effect would not be realized.
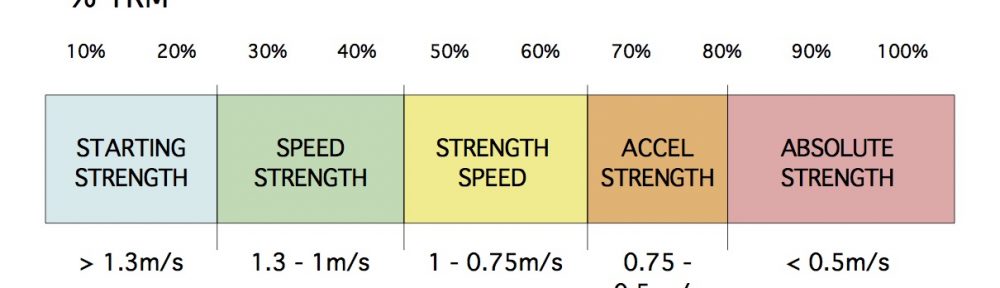
Instead, if one trains by moving a weight at a specific target velocity, and adjusts the weight so that a maximal effort results in that desired velocity for a series of reps, then you will always be training “correctly” for a desired functional result even when your 1RM changes (up or down). There are now generally-accepted velocity ranges that target specific functional benefits. These are shown in the Fig. 5 below.
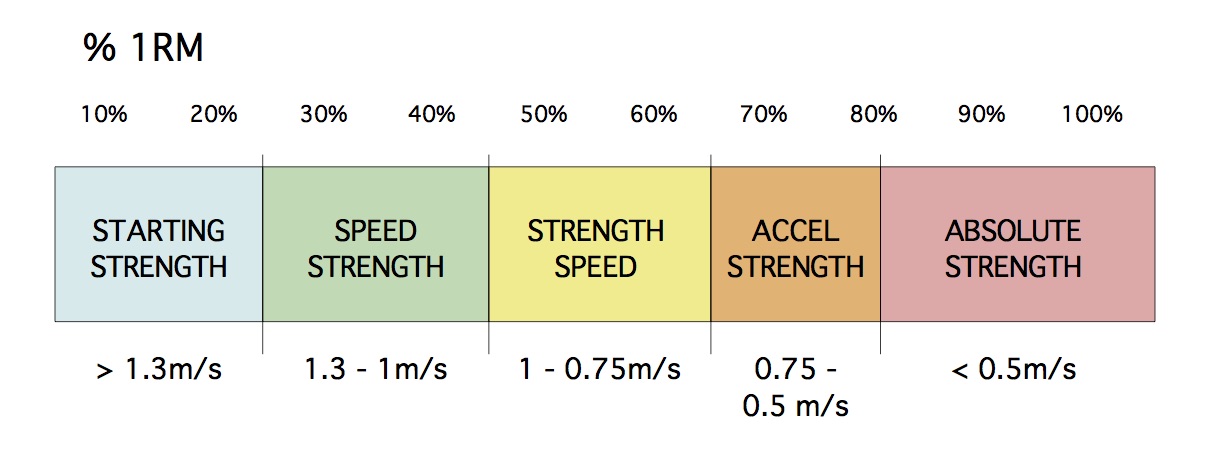
Fig. 5: Velocity ranges and associated functional benefits.
In this Figure[11] slower velocity ranges are to the right, while faster velocity ranges are to the left. There are two particularly interesting velocity ranges: Speed-Strength, and Strength-Speed. Mann[12] defines Strength-Speed as “moving a moderate weight as fast as possible, and has a higher rate of force development compared to accelerative strength.” Mann further defines Speed-Strength as “moving a lighter weight as fast as possible,” and notes that “[t]his trait has the second highest rate of force development of all the traits.” Paddlers know that we’re exerting a force quickly through the water, so it would seem that doing strength training somewhere in this velocity range would be relevant for paddlers based on these descriptions. I set out to do just that.
Using the Beast sensor I performed the following exercises: Lat pulldown, inverted row, pushup, and overhead cable press. My goal was an average velocity of 0.75 m/s over a set, which corresponds to the lower velocity end of the Strength-Speed range above. I chose this as a starting point since it led me to select weights that provided enough resistance to make the lifts “interesting.” Faster velocities like 1.0 m/s just felt too easy. For the overhead cable press and the lat pulldown I experimented so as to determine what weight I could move at 0.75 m/s velocity. And by “could move” I mean pop the exercise at the highest average velocity I could attain, using good form, so that for each lift I achieved as close to 0.75 m/s as I could and felt that I could not have moved the weight any faster. No cheating! The good news is that the app displays the average velocity you achieve for each and every rep, as shown in Fig. 4. This instant feedback is both fascinating and encouraging; you know exactly where you’re at.
As to how many repetitions per set, and how many sets, well, that involves a bit of art that is informed by science. Others may disagree with my reasoning, and that’s fine. Those of you who dug into the details of the Science of Paddling post “What Fuels You” will recall that the phosphate system, which ultimately fuels the muscles, has a store of “free” energy in the form of Adenosine Triphosphate (ATP) stored in the muscles that can be expended over the first 10-12 seconds of exercise, say in a sprint, or… lifting weights! After that the other metabolic systems take over. It takes about 2-3 minutes of rest for this store of “free” ATP energy to be replenished in the working muscles (not all muscles; just the working muscles are depleted). I reasoned, then, that I should perform a specific exercise for 10-12 seconds[13] at the maximum speed I could for a given weight, then move on to the next exercise (and different working muscles group) so that the ATP store would (1) be mostly depleted over the set, and (2) subsequently replenished before starting the next set. I rested between circuits to ensure my working muscles were ready for the next one. This 10-12 second bound for a set almost always resulted in 8 reps for the 0.75 m/s target velocity, and I would usually see the velocity of each rep start to slowly decline over a set, as shown in Fig. 6. I often found that my “best” rep was the second or third rep. Not sure why.
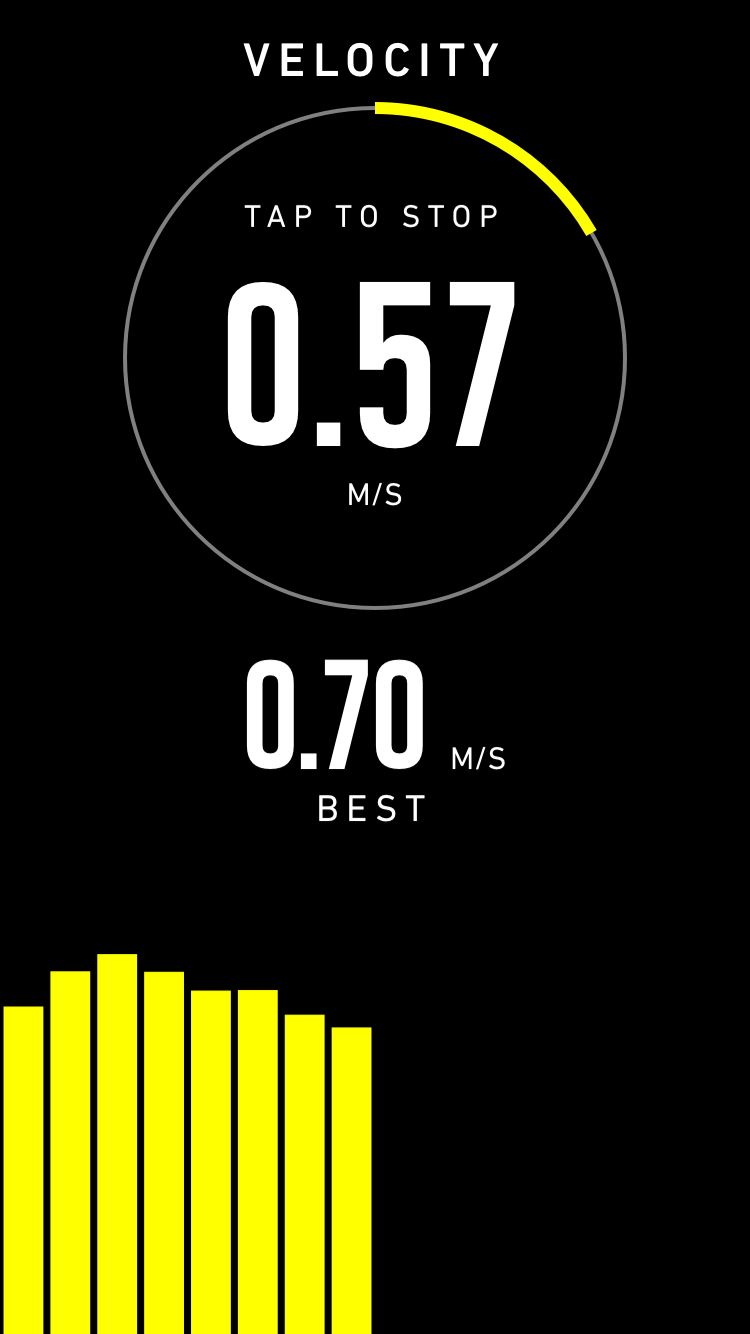
Fig. 6: Degradation of velocity over a set.
I interpret this decline in velocity as a sign of depletion of the ATP stores, as well as other neuromuscular and biochemical factors coming in to play that limit the muscle group’s ability to continue doing work at that rate. It’s also great feedback – if you’re not hitting your target average velocity over a set you may have to adjust the weight up or down to get the specific training benefit you’re looking for. After the first few trial sessions I established 8 reps/set as my goal at 0.75 m/s. Again, these are not sets done to failure like in “classic” strength training. They are done within a defined time range for reasons noted above, with an eye to monitoring degradation of average rep velocity over the course of the set. VBT is about quality, not quantity. I’m currently doing 3 sets/session, with a goal of increasing that gradually to 5 sets/session as long as I can hit the target velocity in each set, with no loss in form.
As to the body weight exercises – pushups and inverted rows – I’ve been able to do sets at the target average velocity of 0.75 m/s for inverted rows, and about 0.6 – 0.65 m/s for pushups. For those of you who have done plyometric pushups, e.g. pushups where you clap your hands at the top of every repetition, this velocity range feels a lot like those during the concentric muscle contraction phase. As I progress with inverted rows I’ll add a weighted vest to increase resistance; ditto with pushups when I get there. Again, the goal is to achieve a target average velocity, not a particular weight. The weight you move will systematically increase over time. If you’re systematically exceeding your target average velocity, it’s time to increase the resistance.
Over a month of VBT sessions I saw modest but consistent, measurable gains in weight moved at 0.75 m/s. That in itself was encouraging. So naturally, as an engineer, I wondered if there is a way to determine experimentally whether or not 0.75 m/s is the “right” average velocity to maximize power. Remember, the cruising speed of a hull is proportional to the cube root of power. I could almost hear Captain Kirk yelling, “Scotty, I need more power!”
Recall that power is the product of weight (force) times velocity. And I noticed that for light weights I could easily exceed my 0.75 m/s velocity target, while for heavier weights I slowed down to as little as 0.28 m/s, e.g. the “Absolute Strength” velocity range in Fig. 5. While it’s nice to work at a target velocity prescribed in a book or technical paper, I became curious as to whether there was a relationship between velocity and power, or weight lifted and power, and if this relationship would indicate an “optimum” velocity that maximized power. In other words, if I varied both velocity and force, what combination yields the most? Fortunately, Mann’s book provided a clue. In it, he showed what is called a “power curve.” He had constructed exemplary power curves from his own bench press workout data. It took several reads through his book to untangle the implications of the power curve, but eventually, I got it.
You see, if you can move a light weight very fast, you might be generating less power than moving a somewhat heavier weight a little less fast. And certainly, lifting a heavy weight slowly might generate even less power than moving a light weight fast. In order to ground this speculation in fact, I constructed a power curve of me performing lat pulldowns. First, I used a digital weight scale to calibrate my cable lat machine to make sure I knew the correspondence between the number of plates and the actual weight moved at the hand grips. Then, I performed lat pulldowns in sets of 8 reps (see above), progressively adding 10 lb between sets, starting at 120 lb and going up to 210 lb (the limit of my machine). At each weight and for each rep I performed the exercise as fast as I could, while maintaining good form. I did no other exercises during this session. Further, between each set I rested for 3 minutes (see above). For the highest weights I limited myself to 4-6 repetitions since I could see my velocity start to drop off with each rep; one VBT rule of thumb is that you should stop an exercise if your reps fall more than 10% below your best rep’s velocity during a set. While tiring, this workout was fun because… data!
After I was done I logged on to the Beast website and recorded the data from my workout; the app automatically uploads your data when you’re finished. I then plotted average power for each set, e.g. at each weight, vs. average velocity. This appears in Fig. 7 below.
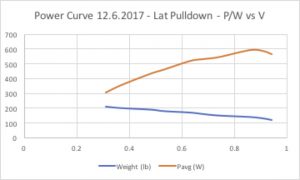
Fig. 7: Power curve for lat pulldowns – power (Watts) and weight lifted (pounds) vs. average velocity (m/s).
The abscissa (sometimes referred to colloquially as the “x-axis” or “horizontal axis”) in this plot is velocity in m/s. Consequently, my first sets, which results in the highest average velocity with the lowest weight, are on the right side of the plot. The slower average velocity data points on the left correspond to the later, higher-weight sets. If you like, I was working from right to left in the plot. It was fascinating and gratifying to see that the plot has a maximum at around 0.84 m/s, which was achieved using 140 lb of weight plates. This is my average velocity for lat pulldowns that generates the maximum average power. Yay! It’s not necessarily the velocity that generates maximum power for anyone else. And it’s not necessarily the velocity that generates maximum power for me on any other exercise. To determine that I’ll need to generate a power curve for each exercise. But by varying both velocity and weight I was able to find my velocity sweet spot to maximize power for this exercise. And the literature suggests that while the weight I can move at this velocity should increase over the coming months with training, the velocity at which I can generate maximum power should stay the same. That’s the underlying benefit of VBT. You know what to target for each workout, and you know where you’re at with each rep.
It was reassuring to note that my max power velocity of 0.84 m/s for lat pulldowns lies within the Strength-Speed range illustrated in Fig. 5. And, if I may be allowed to extrapolate, I’ll contend that exercises like lat pulldowns, overhead cable presses, inverted rows, and cable rows are paddling-specific exercises. If I train to maximize my ability to generate power with these exercises using a velocity sensor, rather than to maximize hypertrophy (building muscle mass) or maximum strength (e.g., force generation) using conventional training prescriptions, I should – emphasis on should – see some benefit on the water when Spring ice-out arrives.
The question now is should I train only at 0.84 m/s, sometimes at 0.75 m/s or 1 m/s, or some other velocity? I don’t know. I’m an experiment; I’ll find out. It’s science!
Now should you follow this path, and try VBT? First off, for liability reasons I have to advise you to consult your doctor before embarking on any exercise plan. At a minimum you should be healthy and not have any muscle, joint, or mobility issues. Everybody runs a high risk of injury or even death doing strength training, including VBT. So just don’t do it. OK?
But for me, I’ve made a few more observations about how my body is responding to VBT that give me some guidance about how to proceed. As they say, “your mileage may vary.” I do three VBT sessions a week. I would absolutely not try VBT unless I had been doing strength training to some significant degree for at least a year or more. And by strength training I mean doing the types of paddling-specific exercises described above, or whatever paddling-specific exercises one might intend to perform. The reason for caution? I see that it would be really easy to injure my shoulders and elbows popping weights so fast. I also worry about developing tendinitis in my elbows, something that I’ve suffered from in the past. I have a base in each exercise from the past year of working out; I think that’s helpful. I’m very, very, VERY careful to pre-load each exercise. In other words, I engage the working muscle chain with the weight (or the grip for cable machines) prior to moving it. This prevents me from putting a jerk load (jerk is the time rate of acceleration) on my joints at the start of a rep. Jerking a load can be destructive to joints and connective tissue, both of which take a long, long time to heal. I’m careful to use excellent form, and strongly engage my core muscles before the start of each set and keep the core engaged throughout. And I will terminate a set if any part of my body experiences even the slightest twinge.
Like anything new I’m cautiously optimistic about VBT. It aligns with the physics of paddling. The data I see is indicative of underlying elements of exercise physiology. Both of these features address the “why am I doing this?” question for me, and I love that. More importantly, I’m having fun. And I can’t wait for Spring!
ADDENDUM – Determining Resistance for Pushups and Inverted Rows
Using a velocity sensor like Beast requires that you enter a weight corresponding to each exercise you do in order to accurately compute power. The little sensor does the velocity part. Now it may be tempting to just use your body weight as input for pushups. But this would be incorrect. First, when you’re standing, you have a single point of contact (your feet) between you and the ground. (OK, you have two feet; let’s just consider them together.) That’s why a weight scale works: there is no other path for weight (which is a force) to “pass through” to the ground. But when you’re doing a pushup you make contact with the ground not only through your feet, but through your hands as well. This means there is a force being transmitted through two points of contact. (I know; it’s really four. But work with me here.) And since the total force being applied to the ground must equal your body weight, the force your moving when doing a pushup must be less than your total body weight. So how do you determine what this weight is? Well, an engineer might be tempted to construct a free body diagram and impose a static equilibrium requirement. But the easier way is to take out that weight scale, get on the floor like you’re going to do a pushup, and put both of your hands atop the scale. Take the reading. That’s the weight you’re moving with each pushup.
As to inverted rows, again you have two points of contact: through your heels to the ground, and through your hands to a bar above you (which is ultimately connected to the ground as well, unless you have a sky hook). And since the inverted row is in most ways just an upside-down pushup, the weight you’re moving with each repetition is essentially the same as what you move doing a pushup. I could prove it with a free body diagram, but just take my word for it.
- For the uninitiated, “rep” is short for “repetition,” a single instance of an exercise movement such as moving a weight. A “set” is a number of consecutive repetitions of a single exercise. ↑
- Single Repetition Maximum is the maximum amount of weight one can lift once and only once for a given exercise. ↑
- A circuit comprises performing one set of an exercise, immediately followed by a set of a different exercise, and so on until all exercises have been performed. ↑
- An inverted row is sometimes called a reverse pushup. It’s like a bench row, but with no bench, and upside down. Heels on the floor, body in a plank, back on or just above the floor, arms extended upwards to a bar (or TRX). Hold the plank and pull, pivoting at the heels. Lower yourself down. Repeat. ↑
- “Traditional” strength training often comprises exercises that isolate muscle groups. Contrast a bench press with a pushup. The former, while a great overall power lifting move, primarily works the triceps, anterior deltoids, and pectoral muscles with secondary activation of surrounding muscles in the upper body. A pushup does that as well but actively engages the core, and much of the biomechanical chain from heels to shoulders. ↑
- And I didn’t fall asleep once! ↑
- While power is a scalar quantity, meaning it doesn’t have a direction, both force and velocity are vectors. This means that force and velocity are directional. For the sake of simplicity we’ll assume that force and velocity are directionally aligned and thus may be thought of as scalar variables. Or if you prefer to be more mathematical, note that the expression for power is a dot product, not a scalar multiplication, and the dot product of two vectors yields a scalar. Your choice. ↑
- And… work has units of energy, like Joules, or Calories. Very convenient. ↑
- Actually, it measures the components of velocity using a MEMS accelerometer and reports back speed in the direction of travel. You know; velocity is a vector, speed is a scalar. But in this article we’ll occasionally conflate the two. Sorry! ↑
- Full disclosure: I bought a Beast sensor with my own funds, and Beast played no role whatsoever in the writing or preparation of this article. ↑
- Note that Fig. 5 also includes indications of % 1RM based on research by Gonzalez-Badillo and Marques that links velocity ranges with training intensity. Just FYI. ↑
- Mann, Bryan, Developing Explosive Athletes: Use of Velocity Based Training in Training Athletes, 3rd Edition, Ultimate Athlete Concepts, Michigan USA (2016). ↑
- Yes, I used a timer. Yes, I’m an engineer. ↑
v 1.0
Copyright (c) 2017, Shawn Burke. All rights reserved. See Terms of Use for more info.